With the introduction of invasive and noninvasive phase mapping in humans, visualisation of rotor activity during atrial fibrillation has emerged as a new concept.1–3 However, phase maps rendered during human atrial fibrillation using noninvasive information from body-surface electrocardiograms (ECGs) versus data from unipolar electrograms (EGs) acquired during invasive contact mapping may show distinct differences. Thus, the accuracy of noninvasive and invasive phase mapping requires further investigation.
Since the spatiotemporal ele ctrophysiologic patterns of cavotricuspid isthmus (CTI)-dependent atrial flutter (AFl) are well defined, AFl serves as a suitable validation model for invasive and noninvasive phase mapping. The current study applied the same phase-processing algorithm to patients with CTI-dependent AFl and compared results from simultaneous invasive multipolar catheter mapping and noninvasive cardiac mapping.
Methods
Patient characteristics
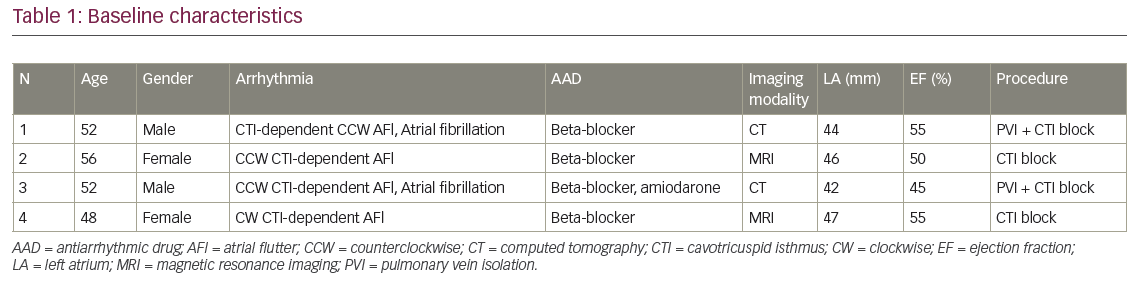
Four symptomatic patients with persistent AFl (two females, aged 52±3.3 years) were enrolled. Three patients exhibited typical counterclockwise (CCW) CTI-dependent AFl and one patient had clockwise (CW) CTI-dependent AFl. The patients’ baseline characteristics are summarised in Table 1. Pre-procedural examination included 12-lead surface ECG and transthoracic echocardiography. The study was approved by the individual hospitals’ institutional review boards. Written informed consent was obtained from all patients.
Noninvasive mapping
The mapping methodology using the noninvasive epicardial and endocardial electrophysiology system (NEEES, EP Solutions SA, Yverdon-les-Bains, Switzerland) has previously been described in detail.4 Briefly, up to 224 magnetic resonance imaging (MRI)-compatible unipolar ECG electrodes, fitted on custom-made arrays were placed circumferentially around the patient’s torso. This was followed by same-day contrast MRI (Magnetom Avanto, 1.5 T, Siemens AG, Germany) scanning of the heart and thorax. The three-dimensional epi- and endocardial biatrial geometry was reconstructed from the MRI images using the NEEES proprietary software. In the electrophysiology laboratory, the electrode arrays were connected to the NEEES multichannel ECG amplifier followed by ECG recording during interventional mapping.
The NEEES recording was performed using a bandwidth of 0.05–500 Hz, a sampling rate of 1,000 samples/s, and an optional notch filter of 50 Hz. To exclude the influence of ventricular activity on phase processing of the atrial signal, the average QRST complex duration for each body-surface lead (using at least 30 consecutive QRST complexes) was calculated and subtracted from each QRST complex. This procedure was performed using the NEEES software. The subtraction procedure did not result in complete elimination of ventricular electrical activity; therefore only T-Q ECG intervals were used for further analysis of AFl patterns.
The body-surface ECG data was processed by the NEEES using its ‘inverse problem’ solution software in combination with anatomical data from the heart and torso. An iterative algorithm for solving the inverse problem of electrocardiography was used.5,6 About 2,500 local unipolar EGs were reconstructed on the epicardial and the endocardial surfaces of the atria. The resulting phase maps were reconstructed on the three-dimensional heart model and displayed as individual frames or propagation maps.
Invasive procedure
All patients underwent invasive electroanatomical mapping using the CARTO 3® (Biosense Webster Inc., Diamond Bar, US) mapping system. A 20-pole HALO® XP (Biosense Webster Inc.) catheter with an inter-electrode spacing of 2-8-2 mm was positioned around the tricuspid annulus spanning the CTI. A 10-pole recording catheter was placed inside the coronary sinus. Entrainment from the CTI was performed verifying macro-reentry as the underlying tachycardia mechanism and the CTI as an integral part of the macro-reentrant circuit. Thereafter, an invasive three-dimensional electroanatomical local activation map (LAT) of the right atrium (RA) was created using the CARTO 3 mapping system in combination with an irrigated-tip mapping and ablation catheter (Navistar® Thermocool®, Biosense Webster Inc.). Ultimately, radiofrequency catheter ablation of the CTI was performed until AFl terminated and bidirectional isthmus block was achieved.
Acquisition of mapping data and preprocessing
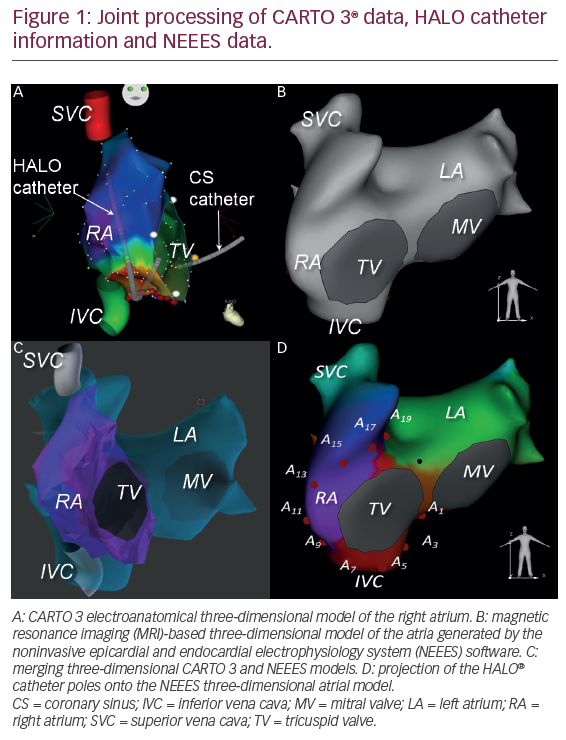
Following successful catheter ablation, the CARTO 3 data, including the three-dimensional atrial model in the form of a polygonal mesh, coordinated the individual poles of the HALO catheter, local bipolar and unipolar EGs recorded by the HALO catheter and the 12-lead surface ECG were exported and processed along with data from the NEEES, which comprised the MRI three-dimensional heart model, the noninvasively reconstructed local unipolar EGs and the 12-lead surface ECG. The three-dimensional models of the atrium generated by CARTO 3 and NEEES were merged utilising a customized software.4 The position of the individual poles of the HALO catheter were projected onto the NEEES atrial model (Figure 1).
Phase mapping
During signal pre-processing, the T-Q intervals with at least two atrial flutter waves were selected for phase analysis. Prior to phase calculation, EGs underwent filtering using a Butterworth filter with a 2–18 Hz transmission band. We used phase-mapping methodology based on calculation of the Hilbert transform.7–9 The phase component of the unipolar signal was calculated using the following formulas.
![]()
![]()
![]()
![]()
where t is time, φ(t) is the signal phase component, u(t) is the unipolar EG and H is the Hilbert transform operator shifting the signal phase by p_2. The Hilbert transform was calculated based on a fast Fourier transform. The two-argument atan2(x, y) function is a variation of the arctangent function that evaluates the angle between the positive x-axis and the point given by the (x, y) coordinates.
Phase maps were generated displaying the signal phase distribution on the surface of the three-dimensional atrial model. The moment of the phase jump from –p to p was defined as the local activation time during the reconstruction of isochronal maps.
A comparison of invasively and noninvasively obtained activation sequences around the tricuspid valve was performed. Data from bipolar EGs, recorded from neighboring HALO electrode pairs (2-1), (4-3), to (20-19) and unipolar EGs recorded from odd-numbered (1, 3, to 19) HALO poles were analysed. For invasive mapping, local activation time (AT) was defined by the earliest onset of the bipolar atrial EG (HALO bipolar AT) and the phase jump of the phase-processed unipolar signal (HALO phase AT).
Following noninvasive reconstruction of unipolar EGs (NEEES phase AT), local EGs recorded by the HALO catheter and endocardial unipolar EGs reconstructed by the NEEES were matched to the position of the HALO poles and synchronised using the 12-lead surface ECG from both systems. Data comprising ≥10 AFl cycles were jointly processed applying the same phase mapping algorithm.
In order to compare activation times, the following parameters were calculated:
- The correlation coefficient (r) between HALO bipolar AT and HALO phase AT, and between HALO bipolar AT and NEEES phase AT.
- The mean value (M) and the standard deviation (σ) of the difference between the reference AT (HALO bipolar AT) and estimated AT (HALO phase AT and NEEES phase AT) determined by the invasive and noninvasive phase jump. The M and σ were defined as:
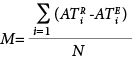
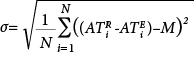
where N is the number of analyzed signals, and
 ,
,  are the estimated activation time and reference activation time, respectively.
 - The root mean square error (RMSE) to quantify the difference between the reference (HALO bipolar AT) and estimated (HALO phase AT, NEEES phase AT) activation times. The RMSE is defined as:
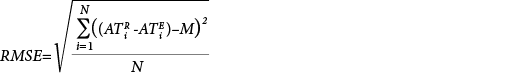
where N is the number of analyzed signals, and ![]() and are the estimated activation time and reference activation time, respectively.
and are the estimated activation time and reference activation time, respectively.
Results
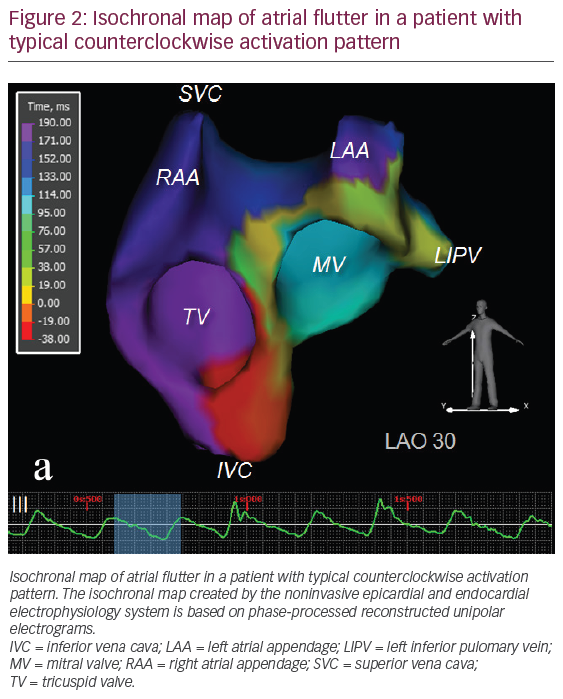
Atrial isochronal phase maps of CCW (Figure 2 and supplemental video 1) and CW AFl (supplemental video 2) obtained during noninvasive phase mapping.
The atrial NEEES phase maps demonstrated the typical excitation pattern of CCW (n=3) and CW (n=1) AFl around the tricuspid annulus, which was confirmed by CARTO LAT mapping. There were differences between the NEEES phase maps and the invasive CARTO LAT and propagation maps. The noninvasive maps demonstrated a non-uniform excitation pattern during the AFl cycle. The phase front accelerated from the lateral wall towards the CTI and decelerated traversing the septal wall and RA roof. This pattern was not observed during invasive mapping.
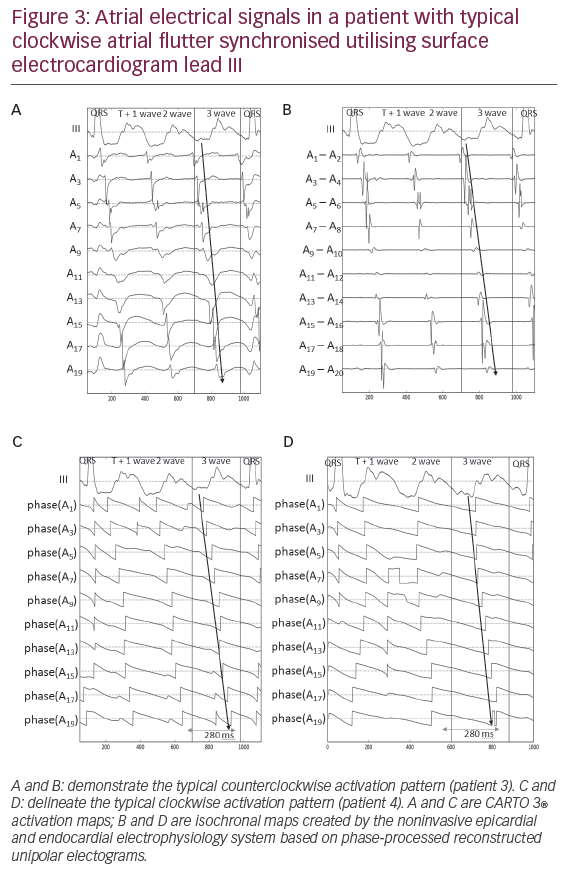
An example of unipolar and bipolar EGs, as well as phase-processed unipolar EGs recorded by the HALO catheter versus noninvasively reconstructed by the NEEES during AFl are presented in Figure 3. Direct comparison of bipolar EGs recorded by the HALO catheter and phase components of the unipolar HALO EGs and NEEES EGs are presented in Figures 4 and 5.
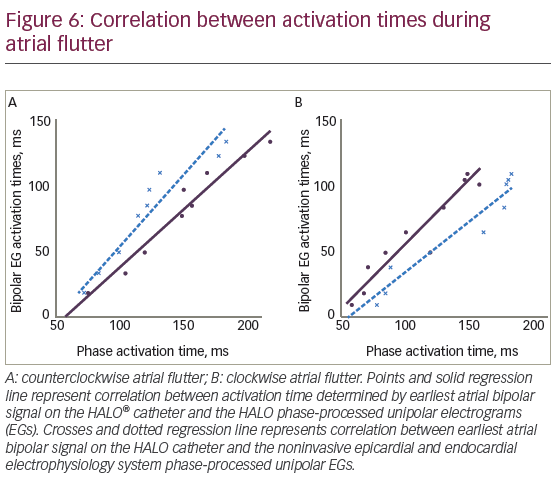
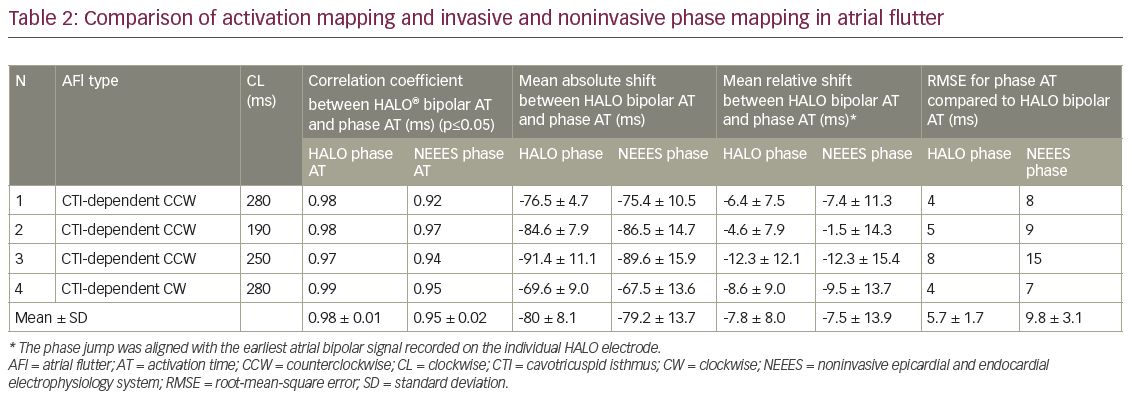
There was a strong correlation between activation times determined by the phase jump in the HALO phase AT and the earliest atrial signal on HALO bipolar AT (Figure 6). The correlation coefficient ranged from 0.97 to 0.98 for CCW AFl and was 0.99 for CW AFl (p≤ 0.05). However, there was a consistent delay in the phase jump compared to the earliest atrial bipolar signal. Mean values for the shift between HALO bipolar AT and the HALO phase AT varied from -76 ± 5 ms to -91 ± 11 ms for CCW AFl and -70 ± 9 ms for CW AFl. A high correlation coefficient and low standard deviation for the delay in HALO phase AT compared to HALO bipolar AT allowed synchronising the phase signals with the earliest bipolar atrial signals. The phase jump was aligned with the earliest atrial bipolar signal recorded on the individual HALO electrode. The mean shift between HALO phase AT and HALO bipolar AT varied from -5 ± 8 ms to -12 ± 12 ms for CCW AFl and -8.6 ± 9.0 ms in CW AFl. The RMSE ranged from 3 ms to 8 ms for CCW AFl and was 4 ms for CW AFl. The correlation between NEEES phase AT and HALO bipolar AT was also strong, demonstrating correlation coefficients between 0.92 to 0.97 for typical CCW AFl and 0.95 in CW AFl (p≤0.05). The phase jump determined noninvasively demonstrated a consistent delay compared to the HALO bipolar atrial signal. Following synchronisation, the RMSE ranged from 5 ms to 11 ms for CCW AFl and 9 ms for CW AFl (Table 2).
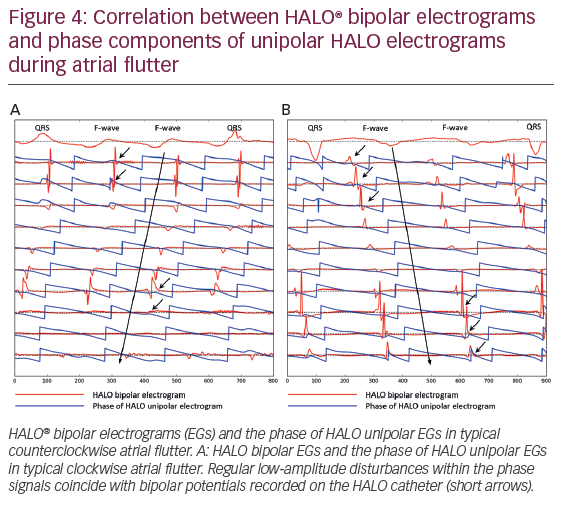
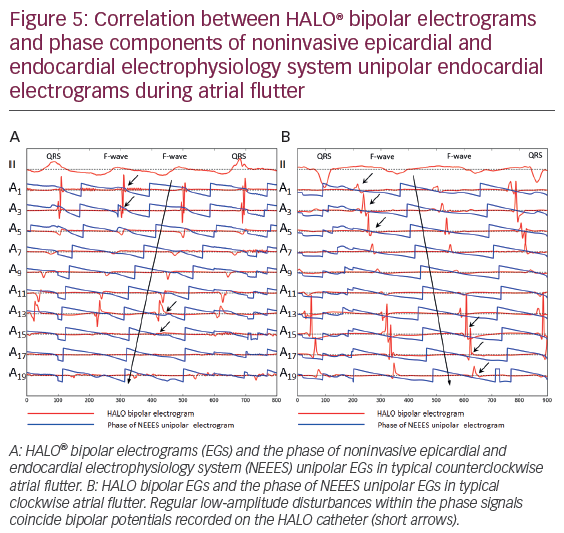
In addition to phase jumps, in all cases regular low-amplitude disturbances were observed for both HALO phase signals and noninvasively reconstructed phase EGs, which coincided with the HALO bipolar atrial potential. These signal disturbances are marked by arrows in Figures 4 and 5. Their intensity varied and occasionally was barely detectable.
Discussion
The results of the current study validate the accuracy of phase mapping for macro-reentrant tachycardia comparing noninvasive and invasive phase mapping with invasive activation mapping. Phase processing of local unipolar EGs, either invasively recorded or noninvasively reconstructed, accurately delineated the counterclockwise or clockwise activation sequence of typical CTI-dependent AFl. For phase processing a simple method of signal detrending was used in addition to a band-pass filtre centered at the AFl dominant frequency and computing the Hilbert transform of a given signal.
There were limitations to the use of phase mapping. First, while for a given bipolar EG, signal onset closely coincided with the beginning of local myocardial activation, the phase jump of the unipolar EG demonstrated a consistent delay. This was seen for invasively and noninvasively processed phase maps allowing only for relative activation time measurements. Second, conduction velocity determined by noninvasive phase mapping was less precise than assessed by invasive phase mapping. The latter observation indicates that the process of noninvasive reconstruction may inflict certain distortions on the unipolar phase-processed EGs and should be considered when developing more advanced techniques for numerical reconstruction of EGs from body-surface ECGs.
Initially, phase mapping was used in experimental ex vivo studies of animal and human cardiac preparations during optical mapping of ventricular and atrial fibrillation. The optical action potentials served as input signals for phase processing.10–15 A signal of cardiac electrical activity such as an action potential or a local electrogram (EG) is characterised by three parameters including amplitude, frequency and phase. It is assumed that the phase of a signal is related to the electrical activation-recovery state of the myocardium at the point of signal registration. To display spatially distributed reentrant activity of cardiac tissue, the instantaneous phase values of a cardiac electrical signal are calculated and colour-coded on a cardiac surface model providing instantaneous phase maps. The propagation of cardiac excitation can be visualised by sequentially displaying a series of instantaneous phase maps.8,9
A crucial step towards proper construction of phase maps is the computational method utilised for calculating the phase of cardiac electrical signals. The most commonly applied method is based on the Hilbert transform, which was initially proposed by Bray and Wikswo.7
Since optical phase mapping is challenging in humans, the methods for transforming optical action potentials into phase values were adapted to work with unipolar EGs.8,9,16,17 Initially, this approach was successfully applied during surgical procedures for mapping of ventricular fibrillation in human hearts.18–20 Subsequently, Narayan et al. reported their experience applying phase mapping technology in human atria to locate AF drivers including electrical rotors and focal impulses, which then were targeted for catheter ablation.2,3 Another study in patients with persistent atrial fibrillation used invasive phase mapping to track the drift of phase singularities in the left atrium and to investigate the spatiotemporal correlation between phase singularities and regions of high dominant frequency.21
During the same period, noninvasive electrocardiographic imaging (ECGI) was developed.22 Based on body-surface ECG mapping, ECGI allows beat-to-beat reconstruction of unipolar EGs from thousands of points on the myocardium. However, the number of unipolar EGs per se is insufficient to provide comprehensive diagnostics of reentrant arrhythmias. Special processing methods are required to accurately depict the sequence of cardiac excitation during reentrant arrhythmias. Initial results of noninvasive mapping of scar-related atypical AFl in humans were described by Wang et al.23 In this work, a classical approach based on detection of unipolar EG intrinsic deflections was used. Later, phase mapping algorithms were introduced to ECGI with encouraging clinical results for mapping and catheter ablation of drivers maintaining AFl and atrial fibrillation.17,24,25
In general, unipolar EG-based phase mapping has shown promising results. However, some methodological challenges remain. Variability in atrial deflection amplitude and length of the isoelectric interval between consecutive atrial EGs pose challenges to accurate phase processing and have yet to be investigated in detail.26 In addition, low-amplitude EGs recorded within unexcitable myocardial zones (such as scar and fibrosis) may provide false excitation patterns on subsequent phase maps.8,9,17
To overcome these challenges, several modifications to the phase mapping methodology were recently proposed. One such approach, the moving average method, uses an advanced signal detrending technique that is less dependent on electrogram morphology and fluctuations.17 Another approach, the sinusoidal recomposition method, uses a special signal transformation technique before applying the Hilbert transform; the technique is ‘based on the recomposition of the EG from sinusoidal wavelets with amplitudes proportional to the negative slope of the EG’.26 These methods can potentially improve the accuracy and increase the robustness of phase mapping.
By contrast, a recent study concluded that the basic application of phase mapping is a robust method to identify reentrant activity in the atrium and therefore inverse-computed unipolar EGs require no additional signal processing to detect rotor activity.27 Importantly, excessive signal filtering may lead to false-positive detection of phase singularities.27 It should be noted that the latter conclusions are based on computer simulations of cardiac electrical activity. In summary, phase mapping based on unipolar EGs remains insufficiently validated in human clinical studies.
Lastly, noninvasive mapping may benefit patients presenting with non-sustained or haemodynamically unstable arrhythmias, e.g., ischaemic ventricular tachycardia. In a recent study by Cuculich et al., noninvasive mapping guided noninvasive radioablation of intractable ventricular tachycardia.28
Limitations
The present study enrolled only a small number of patients (n=4) with typical AFl limiting extrapolation of results to all patients with atrial reentrant tachycardias. Use of the HALO XP catheter limited mapping to the tricuspid annulus region rather than to the entirety of the RA. Therefore, a direct and synchronised comparison of noninvasive beat-to-beat panoramic mapping data and interventional data was not performed.
Conclusions
Noninvasive phase mapping can accurately reconstruct the excitation pattern of typical CTI-dependent CCW and CW AFl. However, invasive and noninvasive phase mapping resulted in a consistent delay in earliest activation time when compared to invasive activation mapping. Noninvasive phase mapping requires further research but may serve as a useful tool to delineate the activation sequence of other types of macro-reentrant tachycardias.