Conventionally, according to the European Society of Cardiology pacing and cardiac resynchronization therapy (CRT) guidelines, patients with clinical heart failure and an echocardiographically measured left ventricular (LV) ejection fraction of <35% are considered for CRT implantation or standard right ventricular (RV) pacing (RVP) system upgrade.1 The recommendations for CRT typically follow failure to improve after 3 months of optimal medical therapy, QRS duration ≥150 ms and left bundle branch block morphology.2 CRT aims to mechanically synchronize the cardiac activity by pacing both ventricles simultaneously and thereby improve LV function.3 The rationale is to prevent electrical ventricular desynchronization, observed during RVP.
CRT requires the implantation of an LV pacing lead, which can be introduced through the coronary sinus or via an extra-cardiac epicardial approach.2,4–8 The lead may be unipolar or multipolar. Multipolar LV pacing is a modality that is used to optimize the cardiac response to CRT by utilizing the potentially best two sites for optimal ventricular activation. About 70% (depending on the chosen criteria) of patients tend to clinically and echocardiographically improve after the procedure and are defined as ‘CRT responders’; the remaining 30% who do not improve are referred to as ‘CRT non-responders’.3,9
Pre-implantation parameters suggesting favourable CRT response include QRS duration ≥150 ms, as well as left bundle branch block pattern with LV electrical activity delay.10 Prediction of positive CRT response may indicate who may benefit from the procedure and conversely who may be spared this intervention. Different imaging approaches have been proposed to facilitate response prediction, including speckle tracking echocardiography (STE) and cardiac magnetic resonance imaging for myocardial scar localization and optimal LV lead positioning.11 STE is conventionally used for myocardial contractility assessment to evaluate objective tissue deformation measurements. By calculating segmental strain, strain rate, LV rotation at different levels, torsion and the strain delay index (SDI), STE may be useful for LV responsiveness assessment and LV scar localization.12–16
The aim of the current study was to echocardiographically assess the LV mechanical activation patterns during RVP, standard CRT single-pole LV pacing and CRT multipolar LV pacing immediately after CRT implantation. This information was used to seek possible response predictors to CRT based on correlations between these measurements and the observed response following 6 months of standard single-pole therapy.
Methods
This study was approved by the Sheba Medical Center institutional review board and was a sub-study of the international multicenter MORE-CRT MPP clinical assessment study (More response on cardiac resynchronization therapy [CRT] with MultiPoint pacing [MPP]; ClinicalTrials.gov identifier: NCT02006069). The study was conducted by Abbott and initiated by St Jude Medical, investigating the impact of the MultiPoint™ Pacing MPP (Abbott Laboratories, Abbott Park, IL, USA) feature of a multipolar LV lead for treatment of patients who were diagnosed as non-responders 6 months after standard single-pole LV CRT treatment.17
Patients who were eligible for CRT defibrillation implantation or RVP upgrade according to the American Heart Association/Heart Rhythm Society heart failure guidelines criteria were enrolled to the MORE-CRT-MPP study. Each patient was implanted with a multipolar LV lead and, after interrogation, a standard single CRT pacing pole was chosen. The patients received standard single-pole CRT pacing for 6 months, after which an echocardiogram was performed. Patients who were diagnosed as non-responders with an LV end systolic volume reduction of <15% entered the MORE-CRT-MPP study and LV MPP was initiated.9
MORE-CRT-MPP study patients who were enrolled to the study at the Sheba Medical Center were invited to also participate in the current sub-study. These patients received an additional observational echocardiogram that had no impact on the MORE-CRT-MPP study. The additional echocardiogram was performed during the first 24 hours after successful implantation of the LV MPP lead and CRT system. The sub-study echocardiogram was performed on a Vivid 9 system (GE Healthcare AS, Oslo, Norway). This echo was designed for LV assessment by using a modified imaging protocol that included the parasternal short axis views at the levels of the mitral valve (SAX-MV), the papillary muscles (SAX-PM), the apex (SAX-AP) and apical chamber views (two-chamber view [2CH], three-chamber view [APLAX] and four-chamber view [4CH]). For the evaluation of pacing modality, this imaging sequence was repeated separately for the following modalities: 1) RVP; 2) biventricular pacing (BVP), which is the standard CRT single-pole LV pacing, with programming of LV to RV delay of 10–20 ms without optimization; 3) CRT LV MPP with programming of LV1 to LV2 delay of 5 ms, and LV2 to RV delay of 5 ms. Patients who had intact atrioventricular conduction were additionally assessed echocardiographically with no pacing at all. A MORE-CRT-MPP study echocardiogram was conducted at 6 months of therapy, serving as the basis for which to classify patients as CRT responders or non-responders according to the LV end systolic volume, with responders defined as having a reduction of ≥15% and non-responders having a reduction of <15%.9 The same classification applies in the current sub-study.
Speckle tracking analysis
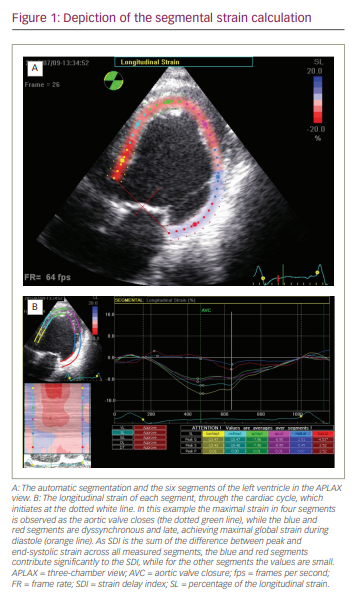
Echocardiographic scans underwent post-processing evaluation using an Echo-PAC Dimension ‘08 (GE Healthcare AS, Oslo, Norway), which allowed longitudinal, circumferential and radial LV evaluation. The analysis of the longitudinal and circumferential segments (six segments for each view) included strain and strain rate measurements. The means of these measurements in each view are termed the global LV strain (GS), the global LV strain rate at early diastole (GSRe), the global LV strain rate at active diastolic phase (GSRa) and the global LV strain rate at active systolic phase (GSRs). Additional measurements for each segment included the time-to-peak, the longitudinal SDI, and the standard time deviation from the onset of the cardiac cycle to the minimum systolic volume. The time-to-peak was the duration to maximal systolic strain normalized to the end systolic time, defined as the time-to-peak of the GS. The longitudinal SDI was measured as described by Lim et al., as the sum of the difference between peak and end-systolic strain across all measured segments (presented in Figure 1).13 For LV torsion calculations, analysis of the mean radial segmental rotation derived from the short axis views were performed. The measurements included the apical rotation and the obverse mitral valve rotation, to produce the calculated ventricular torsion.
Due to between-patient diversity, we normalized the results in order to evaluate GS percentage change for each modality. We thus calculated a ratio in which the denominator was the standard measurement conducted during RVP, and to which we compare the measurements of BVP and MPP. This ratio showed the relative change percentage in GS for each pacing modality in each group.
Statistical analysis
All data are presented as mean and standard deviation. For data analysis, global data of each view (2CH, APLAX, 4CH, SAX-AP, SAX-PM, SAX-MV) were clustered according to their pacing modality (no pacing, RVP, BVP and MPP). For the segmental data analysis, we clustered measurements according to their view, segment and pacing modality. Finally, each patient was classified as a responder or a non-responder. In order to compare between groups, data were analysed using the Mann–Whitney rank sum test. A p value of <0.05 was considered significant.
Results
Eighteen patients were enrolled in this study (17 male and 1 female). The mean age of patients was 66.3 ± 9.4 years (range 45–85 years). During the 6-month therapy period, 2 patients dropped out of the study and were not categorized as either CRT responders or non-responders (1 patient died and the other was found to be non-compliant). Of the 16 patients included in the study (data presented in Table 1), 7 patients were diagnosed as responders and 9 as non-responders. Ten patients had ischaemic heart disease and 6 had non-ischaemic heart failure. The mean QRS duration in the un-paced patients (n=11) was 158 ± 18 ms (range 132–188), and the mean LV ejection fraction was 21 ± 7% (range 10–30%).

All patients had adequate short axis views (circumferential and radial analysis: responders n=7, non-responders n=9). One CRT responder and 2 CRT non-responders yielded limited apical echocardiographic windows with limited longitudinal views. These patients’ apical views were not analysed further (longitudinal analysis responders n=6, non-responders n=7). Out of the cohort of 16 patients, 14 had intact atrioventricular conduction and were sampled with no pacing (responders N=5, non-responders N=9).
With respect to apical longitudinal GS and strain rate data, only one significant finding emerged that differentiated CRT responders from non-responders – namely the APLAX view during BVP, where the GS was -8.7 ± 2.3% in the CRT responder group and -6.3 ± 1.4% in the non-responder group (p<0.05). Similar findings were observed when evaluating the circumferential GS and strain rate data, where there were almost no differences between the groups except for two significant findings: during no pacing, at the level of the mitral valve, the GS was -5.3 ± 0.6% in the CRT responder group and -9.3 ± 0.6% in the non-responder group (p<0.05); and during BVP, at the apical level, the GSRs was -0.4 ± 0.2% in the CRT responder group and -0.7 ± 0.2% in the non-responder group (p<0.05).
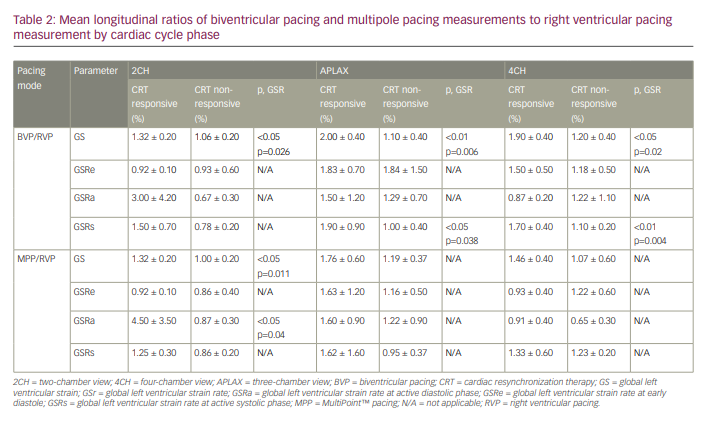
On the other hand, the variance between different pacing modalities calculated as the ratio between the measurements during BVP and RVP showed that the BVP/RVP ratio of the GS was significantly higher in all the apical views (Table 2). In the CRT responder group compared with the CRT non-responder group, the BVP/RVP ratio was 1.32 ± 0.2 versus 1.06 ± 0.2, respectively (p<0.05) in the two-chamber view, 2.0 ± 0.4 versus 1.1 ± 0.4, respectively (p<0.01) in the APLAX view and 1.9 ± 0.4 versus 1.2 ± 0.4 respectively (p<0.05) in the four-chamber view. Similarly, the BVP/RVP ratio of the GSRs was also significantly higher in the two apical views. In the CRT responder group compared with the CRT non-responder group, BVP/RVP ratio was 1.9 ± 0.9% versus 1.0 ± 0.4%, respectively (p<0.05) in the APLAX view, and 1.7 ± 0.4% versus 1.1 ± 0.2%, respectively (p<0.01) in the four-chamber view.
The BVP/RVP ratio calculations of the circumferential measurements (Table 3) showed that in the CRT responder group compared with the CRT non-responder group, there was a higher ratio of the GS only at the level of the papillary muscles of 1.54 ± 0.5% versus 0.97 ± 0.5%, respectively (p<0.05).
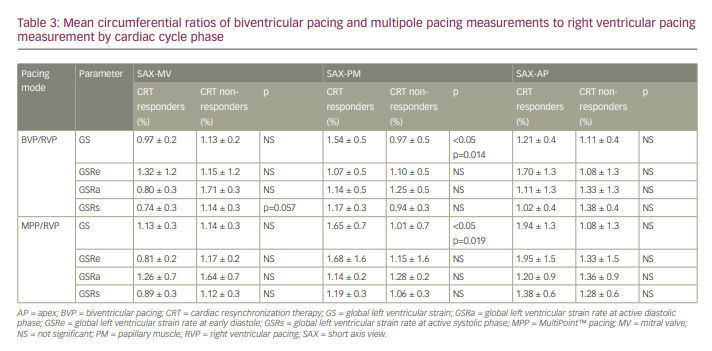
The longitudinal calculated ratio between the measurements during MPP and RVP (MPP/RVP ratio), was significantly higher in the apical views only in the two-chamber view (Table 2). In the CRT responder group compared with the CRT non-responder group, the GS was 1.32 ± 0.2% versus 1.00 ± 0.2%, respectively (p<0.05), and the GSRa was 4.5 ± 3.5% versus 0.87 ± 0.3%, respectively (p<0.05). This was not reproduced in the other apical views. Regarding the circumferential data, the MPP/RVP ratio was significantly higher only at the level of the papillary muscles (1.65 ± 0.7% versus 1.01 ± 0.7%, respectively; p<0.05).
The evaluation of the circumferential rotation at the mitral valve, the apex and the calculated torsion showed no differences at all between the responders and the non-responder groups.
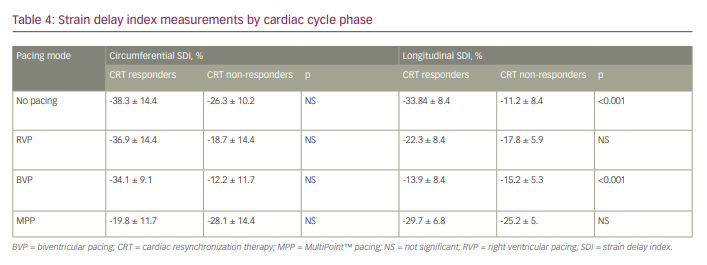
Mean SDI measurements (Table 4) showed two interesting findings. The longitudinal measurements were significantly lower among non-paced patients with CRT response than in non-responders (-33.84 ± 8.4 ms versus -11.2 ± 8.4 ms; p<0.001), and inversed during BVP pacing measuring (-13.9 ± 8.4 versus -15.2 ± 5.3; p<0.001).
Discussion
STE analysis has become a widely accepted and routinely practiced method for cardiac tissue deformation analysis, especially in patients with heart failure. It is currently used to evaluate global LV function and regional LV desynchrony, which indicates the presence of scar tissue affected by ischaemia or other cardiomyopathies.18 Its application for the optimal positioning of the LV lead at the site of latest mechanical activation demonstrates consistent beneficial results, as shown in the Targeted left ventricular lead placement to guide cardiac resynchronization therapy (TARGET) study; (TARGET; ISRCTN19717943) and the STARTER (Predictors of response to biventricular pacing in heart failure; ClinicalTrials.gov identifier: NCT00156390) trial.19,20 Both of these trials confirmed that the placement of the LV lead according to guidance derived by STE may reduce heart failure morbidity and mortality compared with routine fluoroscopic lead placement.19,20
Although STE has yielded some success in allowing prediction of positive CRT response, selection of the best candidates for CRT remains an unresolved issue, as 30% of patients who undergo the procedure do not respond favourably clinically.3,9 Lim et al. showed that SDI has a strong predictive value for CRT response in both ischaemic and non-ischaemic patients.16 More recent studies have shown that septal contraction patterns may be strongly associated with CRT-induced reduction in LV end-systolic volume, and may thus hold additive prognostic information regarding future CRT responsiveness.21,22 Patients’ prognosis, however, may be insufficient in predicting CRT responsiveness, as documented by DeVecchi et al. with respect to contractile recovery in patients following CRT.23
In the current study, we investigated the possibility of using STE as a prediction tool for successful CRT implantation treatment. We were able to image patients immediately after the implantation, documenting cardiac function using all types of pacing prior to any remodelling achieved by the CRT. Similarly to previous studies, we found that no value of GS or GSR, or their change, allowed any prediction regarding CRT responsiveness. This is mainly due to the wide range between patients in terms of age, weight and cardiac function.
However, the ratio between the measurements in all the apical views during BVP and RVP showed that the BVP/RVP ratio of the GS was significantly higher in the responder group compared with the non-responder group. The CRT responder group ratios were 1.32 ± 0.2, 2.0 ± 0.4 and 1.9 ± 0.4 compared with 1.06 ± 0.2, 1.1 ± 0.4 and 1.2 ± 0.4 in the non-responder group, in the two-chamber, APLAX and four-chamber views, respectively. Similarly, the BVP/RVP ratio of the strain rate at active systolic phase (GSRs) was found to be significantly higher in the responder group compared with the non-responder group. The CRT responder group ratios were 1.9 ± 0.9% and 1.7 ± 0.4% compared with 1.0 ± 0.4% and 1.1 ± 0.2% in the non-responder group in the APLAX and four-chamber views, respectively. The results in the two-chamber view also showed a difference (1.5 ± 0.7% versus 0.78 ± 0.2%), although this was not statistically significant. These results show that no change between the pacing modalities, defined as a ratio of 0.9–1.1, corresponded with no future CRT response, while an increase in GS and GSRs ratio of over 1.4% correlated with a positive CRT response. In other words, measuring longitudinal GS and GSRs and comparing the results between RVP and BVP immediately after the implantation enabled CRT response prediction. This coincides well with the fact that better activation of the LV at early systole may increase overall LV strain. SDI measurement (the standard time deviation from the onset of the cardiac cycle to the minimum systolic volume) also showed predictive power regarding CRT responsiveness, mainly during assessments when the patients were not paced, as established by Lim et al.16
These new findings may support operators during the procedure. As the lead is placed according to the suggested site of latest mechanical activation, an intraprocedural echo may be conducted and the LV mechanical activation may be evaluated, thus allowing real-time estimation of the changes due to the different pacing modalities and optimal positioning of a single- or multipolar lead over the LV.
Unlike the BVP/RVP ratio, the MPP/RVP ratio was significant only in the apical two-chamber view. The fact that MPP did not reflect the pattern showed by the above measurements may not be surprising, as MPP-CRT responder and non-responder groups may differ after 6 months of MPP. Thus, if the patients had been paced differently, the response to pacing would be different, and so would the echocardiographic analysis.
Limitations
As this study was a sub-study of the multicentre MORE-CRT-MPP study, a limited number of patients with heart failure were enrolled.17 The small sample size in this preliminary study precludes general applicability of the findings at this stage. A further limitation was the low quality of longitudinal imaging due to patients’ body habitus, which hindered precise measurement and consequent calculations. Nonetheless, the results of this study represent an innovative way by which the cardiac functionality of patients with heart failure can be measured in real time with immediate applicability. Further research is required to corroborate the results of the current study, determine with greater precision the cutoff points, and generalize the predictive power of BVP/RVP ratio and SDI to diverse populations.
Conclusion
By using the BVP/RVP ratio, our study suggests a promising method of determining optimal placement of a pacing lead to ensure CRT responsiveness over time in patients with heart failure undergoing CRT. This study also supports earlier findings showing that SDI measured by echocardiography in patients with heart failure prior to CRT implantation may be useful for predicting CRT responsiveness in non-paced patients.