touchCARDIO touchCARDIO
Imaging
Read Time: 2 mins

37/Retro-mapping – A 5-dimensional framework for mapping wavefronts during AF reveals mechanistic insight with both focal activation and stable vectors

Copy Link
Published Online: Oct 4th 2008 European Journal of Arrhythmia & Electrophysiology. 2019;5(Suppl. 1):abstr37
Authors: I Mann (Presenting Author) – Imperial College London, London, UK; N Linton – Imperial College London, London, UK; Coyle – Imperial College London, London, UK; N Qureshi – Imperial College Healthcare NHS Trust, London, UK; M Koa-Wing – Imperial College Healthcare NHS Trust, London, UK; PB Lim – Imperial College Healthcare NHS Trust, London, UK; Z Whinnett – Imperial College Healthcare NHS Trust, London, UK; P Francis – Imperial College London, London, UK; S Peters – Imperial College London, London, UK; P Kanagaratnam – Imperial College London, London, UK
Quick Links:
Article
Article Information
Article:

Background: Activation mapping of atrial fibrillation (AF) wavefronts is labour intensive and often restricted to short time segments. RETRO-Mapping identifies uniform wavefronts, summates their vectors onto an orbital plot, and projects this onto the 3D geometry. Sequential mapping of different areas of atria enables a 5D choropleth map to be created, displaying every wavefront over the mapping period on a single 3D geometry to study the AF substrate.

Methods: Seventy-five patients (pts) underwent left atrial mapping using the AFocusII in multiple 30 s data segments with Precision™. Data collected during atrial tachycardia and sinus rhythm (30 wavefronts in 6 pts), and AF (1373 wavefronts in 10 pts) were used to validate the algorithms manually. One hundred and sixty-one locations (n=18 pts) were mapped during AF for 60 s each, sampling locations around the entire LA. The orbital plots from the first 30 s were compared with the second 30 s at each location, and also with a further remap done 10 minutes later. CFAE and bipolar voltage maps were constructed from 8 s segments. Manual review of the wavefront maps was performed to screening for focal activation. The impact of pulmonary vein isolation was also studied (277 locations, n=23 pts).

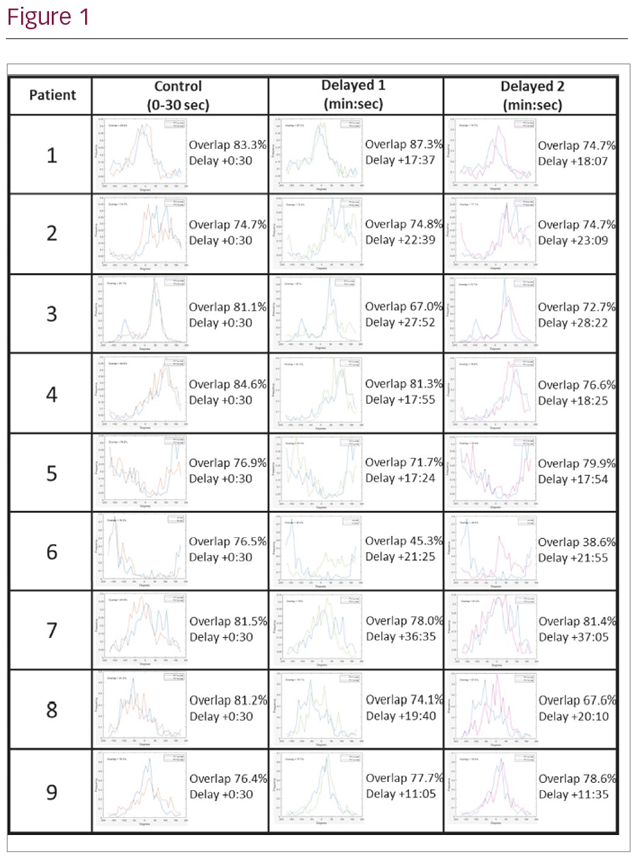
Results: There was no difference between manual and automated activation mapping of AF (Bland-Altman: 95% CI –0.4° to 0.2°). Spatiotemporal stability of activation was demonstrated between the two 30 s pre-PVI maps (mean percentage match 79.5 ± 7.7; 95% CI 78–80.5), with no difference in activation pattern on delayed re-mapping (p=0.8, n=9), shown in the figure below. Importantly, orbital plots at each location were frequently eccentric suggesting anatomically stable preferential direction of activation. There was no difference in voltage or CFAE between maps (p>0.5). Thirteen out of 18 patients showed evidence of focal activations in 32/114 segments. Activation wavefronts became significantly more organised post PVI (p<0.01).

Conclusion: Atrial fibrillatory activity includes organised wavefronts with preferential directions of activation that are spatio-temporally stable. These can be detected and displayed by an automated algorithm (that also allows detection of focal activations). Wavefront coherence is increase by PVI. RETRO mapping allows display of this data such that it may be possible to deduce the mechanism and targets for ablation in a similar manner to diagnosing complex atrial tachycardias.


Further Resources

Share this Article
Related Content In Imaging
  • Copied to clipboard!
    accredited arrow-down-editablearrow-downarrow_leftarrow-right-bluearrow-right-dark-bluearrow-right-greenarrow-right-greyarrow-right-orangearrow-right-whitearrow-right-bluearrow-up-orangeavatarcalendarchevron-down consultant-pathologist-nurseconsultant-pathologistcrosscrossdownloademailexclaimationfeedbackfiltergraph-arrowinterviewslinkmdt_iconmenumore_dots nurse-consultantpadlock patient-advocate-pathologistpatient-consultantpatientperson pharmacist-nurseplay_buttonplay-colour-tmcplay-colourAsset 1podcastprinter scenerysearch share single-doctor social_facebooksocial_googleplussocial_instagramsocial_linkedin_altsocial_linkedin_altsocial_pinterestlogo-twitter-glyph-32social_youtubeshape-star (1)tick-bluetick-orangetick-red tick-whiteticktimetranscriptup-arrowwebinar Sponsored Department Location NEW TMM Corporate Services Icons-07NEW TMM Corporate Services Icons-08NEW TMM Corporate Services Icons-09NEW TMM Corporate Services Icons-10NEW TMM Corporate Services Icons-11NEW TMM Corporate Services Icons-12Salary £ TMM-Corp-Site-Icons-01TMM-Corp-Site-Icons-02TMM-Corp-Site-Icons-03TMM-Corp-Site-Icons-04TMM-Corp-Site-Icons-05TMM-Corp-Site-Icons-06TMM-Corp-Site-Icons-07TMM-Corp-Site-Icons-08TMM-Corp-Site-Icons-09TMM-Corp-Site-Icons-10TMM-Corp-Site-Icons-11TMM-Corp-Site-Icons-12TMM-Corp-Site-Icons-13TMM-Corp-Site-Icons-14TMM-Corp-Site-Icons-15TMM-Corp-Site-Icons-16TMM-Corp-Site-Icons-17TMM-Corp-Site-Icons-18TMM-Corp-Site-Icons-19TMM-Corp-Site-Icons-20TMM-Corp-Site-Icons-21TMM-Corp-Site-Icons-22TMM-Corp-Site-Icons-23TMM-Corp-Site-Icons-24TMM-Corp-Site-Icons-25TMM-Corp-Site-Icons-26TMM-Corp-Site-Icons-27TMM-Corp-Site-Icons-28TMM-Corp-Site-Icons-29TMM-Corp-Site-Icons-30TMM-Corp-Site-Icons-31TMM-Corp-Site-Icons-32TMM-Corp-Site-Icons-33TMM-Corp-Site-Icons-34TMM-Corp-Site-Icons-35TMM-Corp-Site-Icons-36TMM-Corp-Site-Icons-37TMM-Corp-Site-Icons-38TMM-Corp-Site-Icons-39TMM-Corp-Site-Icons-40TMM-Corp-Site-Icons-41TMM-Corp-Site-Icons-42TMM-Corp-Site-Icons-43TMM-Corp-Site-Icons-44TMM-Corp-Site-Icons-45TMM-Corp-Site-Icons-46TMM-Corp-Site-Icons-47TMM-Corp-Site-Icons-48TMM-Corp-Site-Icons-49TMM-Corp-Site-Icons-50TMM-Corp-Site-Icons-51TMM-Corp-Site-Icons-52TMM-Corp-Site-Icons-53TMM-Corp-Site-Icons-54TMM-Corp-Site-Icons-55TMM-Corp-Site-Icons-56TMM-Corp-Site-Icons-57TMM-Corp-Site-Icons-58TMM-Corp-Site-Icons-59TMM-Corp-Site-Icons-60TMM-Corp-Site-Icons-61TMM-Corp-Site-Icons-62TMM-Corp-Site-Icons-63TMM-Corp-Site-Icons-64TMM-Corp-Site-Icons-65TMM-Corp-Site-Icons-66TMM-Corp-Site-Icons-67TMM-Corp-Site-Icons-68TMM-Corp-Site-Icons-69TMM-Corp-Site-Icons-70TMM-Corp-Site-Icons-71TMM-Corp-Site-Icons-72