Background: 3D electroanatomical mapping systems demonstrate atrial scar by recording local tissue voltages as a surrogate. Increased scar has been shown with both progression of atrial fibrillation (AF, paroxysmal [PAF] to persistent [PeAF]), and between sinus rhythm (SR) and AF on low-density mapping systems. The introduction of ultra-high-density mapping allows a more detailed comparison.
Objectives: Assessment of atrial scar determined by voltages and surface area between atria, rhythm and AF type.
Methods: Patients undergoing AF ablation were recruited. Ultra-high-density 3D electroanatomical maps of left and right atria (LA, RA) were created (Orion, Rhythmia HDx). PeAF patients had maps created in AF and SR (proximal coronary sinus pacing) following DC cardioversion. PAF patients had maps created in SR only. Non-atrial mapped areas and sites of previous ablation were excluded. Electrograms (EGMs) on corresponding AF and SR maps were paired using exported co-ordinates. Percentage surface area of scar was determined and assigned as low-voltage myocardium (LVM, ≤0.05 mV), intermediate (IVM, 0.05–0.5 mV) or normal (NVM, >0.5 mV).
Results: A total of 40 patients (PAF 10; PeAF 30; male 21/40; age 66.7 ± 8.8 years; procedure length 235 ± 48 min; ablation time 31.1 ± 15.8 min) were recruited producing 95 maps (LA SR 38; LA AF 30; RA SR 17; RA AF 10). A total of 913,480 EGMs proceeded to analysis (mean EGMs per map: LA SR 10,097 ± 2,779; LA AF 10,296 ± 2,176; RA SR 8,119 ± 1,937; RA AF 8,290 ± 1,802). Paired SR-AF EGM voltages had a moderate–strong correlation in the LA (bipolar Pearson’s R = 0.50; unipolar R = 0.40; both p<0.0005), and moderate correlation in the RA (bipolar R = 0.32; unipolar R = 0.30; both p<0.0005). Paired voltages were significantly higher in SR in both atria (LA – bipolar mean voltage ratio SR/AF = 2.0, unipolar mean voltage SR/AF = 1.5; RA – bipolar mean voltage SR/AF = 1.5, unipolar mean voltage SR/AF = 1.2; all p<0.0005). There was significantly more LVM/IVM percentage surface area in AF over SR in the LA (SR to AF – LVM 6.4 ± 6.9 to 12.2 ± 9.5; IVM 41.0 ± 12.1 to 50.5 ± 10.0; NVM 51.7 ± 17.2 to 37.3 ± 16.1; p<0.0005), but interestingly not in the RA (SR to AF – LVM 6.5 ± 5.3 to 8.4 ± 8.3; IVM 42.0 ± 10.1 to 44.6 ± 6.9; NVM 51.5 ± 13.6 to 47.0 ± 13.8; p=0.62). Global tissue voltages in SR were significantly higher in PAF over PeAF in both atria (LA – bipolar mean voltage PAF/PeAF = 2.1, unipolar mean voltage PAF/PeAF = 1.4; RA – bipolar SR/AF = 1.4, unipolar SR/AF = 1.3; all p<0.0005). There was significantly more LVM/IVM surface area demonstrated in PeAF over PAF in the LA (PAF to PeAF – LVM 0.6 ± 0.7 to 6.6 ± 6.8; IVM 29.5 ± 12.3 to 43.1 ± 11.4; NVM 69.8 ± 12.8 to 50.3 ± 16.4; p=0.01), but not in the RA (PAF to PeAF – LVM 4.6 ± 3.6 to 6.5 ± 5.3; IVM 32.7 ± 9.5 to 42.0 ± 10.1; NVM 62.7 ± 12.1 to 51.5 ± 13.6; p=0.20).
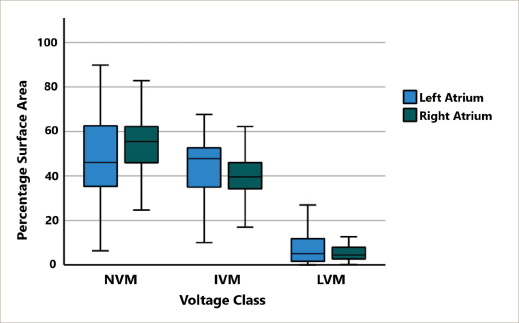
Comparing atria, the LA had a significantly lower voltage in SR, but this difference was small (LA/RA = 0.89; p<0.0005). The percentage surface area of scar was comparable (LA to RA – LVM 4.0 ± 5.6 to 5.6 ± 4.5; IVM 38.4 ± 37.6 to 37.6 ± 10.6; NVM 57.5 ± 18.4 to 56.8 ± 13.8; Figure 1).
Conclusions: Ultra-high-density mapping confirms atrial voltages
are higher in SR over AF, and PAF over PeAF. The RA is comparable to the LA for tissue voltages but does not demonstrate a change in surface area of scar between AF and SR or PAF and PeAF. This may reflect the complexity of AF wavefronts in the LA compared with the RA leading
to more bipole orientation-related overestimation of scar in the
fibrillating LA. ❑
Figure 1