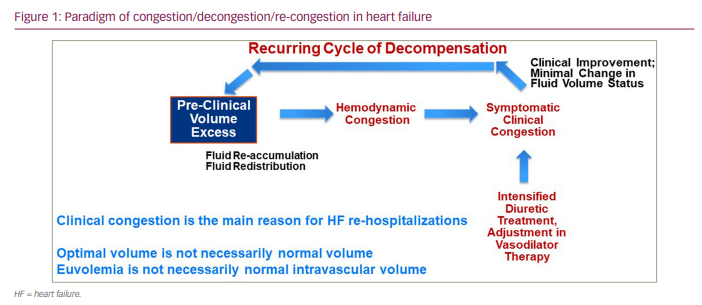
Heart failure (HF) is a common clinical diagnosis often requiring hospitalization secondary to patient decompensation associated with clinically determined ‘dry’ or ‘wet’ volume states. However, fluid overload is the more common basis for clinical deterioration accounting for the majority of hospitalizations.1–4 There is often a cycle of decompensation, compensation following intervention and then a recurrence of volume overload again requiring intervention (Figure 1). The relief of congestion, therefore, is a central goal for the management of patients with HF, and intravenous diuretic therapy is frequently employed to reach that goal.5 In this context, ‘congestion‘ most often refers to clinically assessed indirect signs and symptoms of HF, such as jugular venous distension, pulmonary rales resulting from interstitial-alveolar oedema, lower–extremity oedema, ascites, dyspnoea with exertion and fluid weight gain. These indicators, however, do not reflect independent pathophysiological changes in haemodynamics, intravascular volume or myocardial function but rather can be the result of multiple mechanisms producing different manifestations (e.g. lower–extremity oedema but without pulmonary oedema); as a result, they lack sensitivity and specificity and, therefore, reliability for volume assessment.6,7 Furthermore, some clinical manifestations of HF evolve to a symptomatic state while others do not; when symptoms of congestion develop, they can be the result of fluid volume expansion (intravascular and interstitial) secondary to renal water and sodium retention or from fluid redistribution (to the central circulation) without absolute changes in overall volume.8,9 Therefore, not all clinical congestion symptoms should be considered to have common driving factors.
The clinical assessment of volume status by physical examination or patient report of symptoms remains a significant challenge even for experienced clinicians and can lead to inadequate or inappropriate treatment with unintended consequences. As a result, many indirect surrogate methods of volume assessment have evolved to fill this clinical gap; however, they lack the true capacity to quantitate volume. Thus, the ability to measure volume directly becomes critical for defining the basis of congestion and guiding the most appropriate approaches for volume management and strategies of patient care. Consequently, this review, while not exhaustive, discusses the clinical relevance and methodologies of volume assessment in patients with HF.
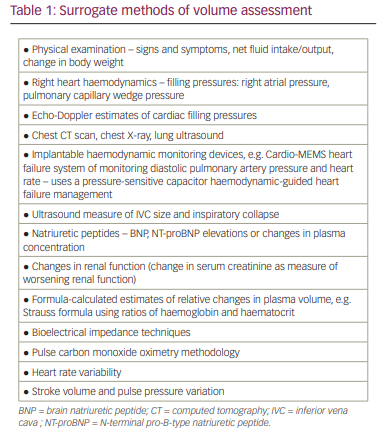
Surrogate methods of volume assessment
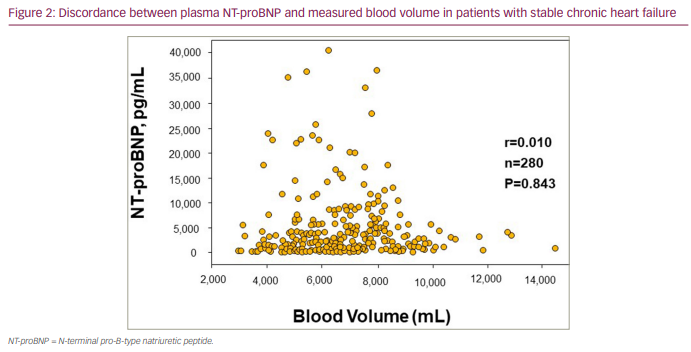
Multiple surrogate methods for estimating or indirectly measuring the volume of fluid compartments have been advanced (Table 1). These methods have included assessing changes in haemoglobin (Hb) concentrations/haematocrit,10,11 ultrasound to assess changes in inferior vena cava dimensions,12,13 bioelectrical impedance techniques,14–17 formula–based calculated estimates of plasma volume (PV),18,19 pulse carbon monoxide oximetry methodologies20 and implantable haemodynamic monitoring devices.21 Plasma levels of natriuretic peptides (NT-proBNP) have also been promoted as indicators of volume status and have demonstrated prognostic value. However, while the release of the peptides (trial natriuretic peptide [ANP], BNP, NT-proBNP) occurs in response to myocardial stretch secondary to volume overload, only a weak association has been demonstrated with measured blood volume (BV) or plasma volume,22–25 which limits reliability as a quantitative indicator of intravascular volume (Figure 2).
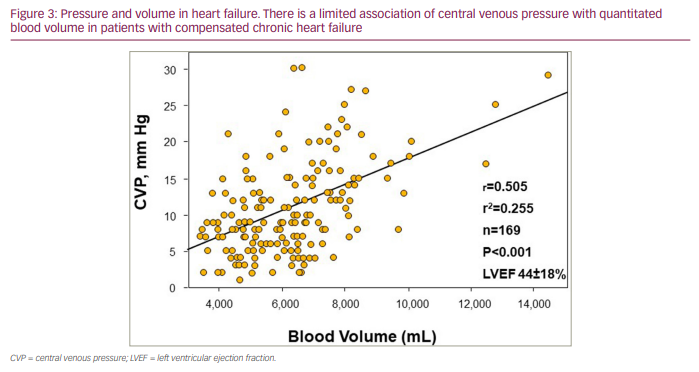
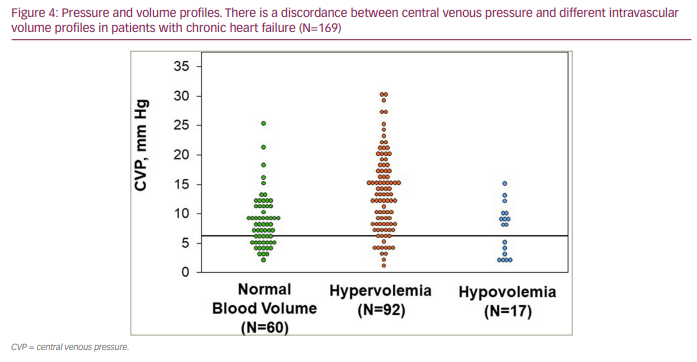
Right heart haemodynamic catheter-based measurements of cardiac filling pressures (right atrial pressure and pulmonary capillary wedge pressure) have historically been commonly used to assess intravascular volume status in patients with decompensated HF. However, similarly to the other surrogate indicators of volume status, central venous pressures have been shown to not correlate well with measured intravascular volumes (Figure 3),25–30 resulting in often marked discordance between central venous pressures and quantitated intravascular volumes (Figure 4) . Thus, while commonly employed in the clinical assessment of HF, particularly of patients with more advanced HF, right heart haemodynamic parameters provide complementary but not intravascular volume status information. These pressure metrics lack the reliability needed to inform decision making regarding volume status and management strategies of fluid resuscitation or extent of diuresis. Furthermore, while congestive symptoms such as pulmonary oedema are generally the result of elevated filling pressures, tolerance to elevated filling pressures develops without symptoms or progression to a decompensated state (adaptation to elevated filling pressures) in some patients with chronic HF. Additionally, an expanded intravascular volume will not cause pulmonary congestion symptoms if cardiac filling pressures are not elevated. This suggests that fluid volume overload and elevated cardiac filling pressures are not mutual requirements for developing clinical signs and symptoms of congestion. Being able to measure intravascular volume, however, can provide direct, objective assessments of volume status and help inform optimal volume management.
Background for the quantitative assessment of intravascular volume
The original concept behind the development of methods for measuring BV has been attributed to Valentin (ca. 1838). This concept involved the quantitation of a change in the concentration of a measurable blood element, such as red blood cells (RBCs) (Hb concentration), produced as the result of the addition of a known volume of fluid. The circulating BV can then be estimated from the effect of dilution and the change in concentration of the total blood element. The methodology thus evolved based upon this principle of dilution of a known amount of an intrinsic marker, such as plasma protein or Hb, or a measurable substance introduced into the circulation. While peripheral venous Hb concentration and plasma haematocrit and changes in these parameters have been used to evaluate intravascular volume status with prognostic benefit,10,11 the absolute or relative changes in these parameters have shown a limited association with direct measures of total BV.31–34
Over time, methods of quantitative volume determination evolved with the introduction of precision indicator-dilution methodology by the calculation of the dilution volume of injected dyes or the labelling of RBCs. The dye-labelling method was first introduced in 1915, with the use of vital red and blue dyes;35 Gibson and Evans36 described the use of one of the early used dyes, Evans blue dye (T-1824; New World Trading Corp., DeBary, Florida),36,37 and indocyanine green dye was introduced in 1957.38,39 These dyes have similar tight binding to plasma proteins, most commonly albumin. With the development of nuclear medicine methods, the radioactive tracer I-131 has become the most used in contemporary radio-iodinated serum albumin techniques for the quantitation of PV.40
The fundamental principle behind the indicator-dilution technique is the following: a known quantity (q) of a given substance is introduced into an unknown volume (V) of a fluid compartment (e.g. intravascular or interstitial); the concentration (C) of that substance is then measured from the unknown volume space after distribution into that compartment. If the quantity and the volume of the introduced substance are known (concentration), then the fluid volume (in millilitres or litres) of the unknown compartment can be calculated from the diluted concentration of the substance (V=q/C). Two requirements are necessary for the volume of the compartment to be quantitated: 1) the value of q must be known at the time the concentration is measured; 2) the value measured for C must be equal to the mean concentration for the entire fluid compartment being assessed. Therefore, complete distribution of the substance within the compartment is necessary. This second requirement cannot be met when introduced labels do not remain within the compartment (transudate to another space) or are rapidly metabolized or excreted. The labelled RBC methods (carbon monoxide, radio-phosphorus P-32 and radiochromium [Cr51]–tagged RBCs) have a theoretical advantage in that tagged RBCs do not leak from the intravascular space or are otherwise removed from the circulation in a timeframe that would affect the testing accuracy. However, for most plasma protein labels, unknown amounts of the label may be lost after an adequate time for thorough mixing within the vascular compartment (usually 10–15 minutes), thus invalidating the first requirement. Moreover, if measurements are taken too close to the time of injection, errors can result from inadequate mixing.
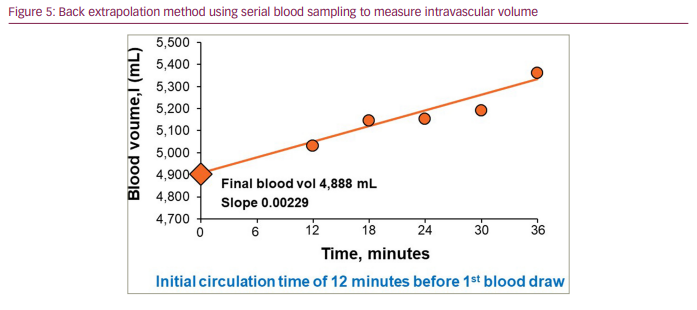
To allow sufficient mixing time to occur for complete distribution of the introduced label and to correct for losses of the label from the circulation during the mixing period, the back extrapolation method was introduced by Erlanger41 and further advanced by Gibson and Evans.36,37 This method entails multiple samples being taken in series over a predetermined period (e.g. 6–minute intervals over 30–40 minutes after the initial mixing period is completed) and the log values of these points are then plotted linearly. Extrapolation back to time zero of the plotted points identifies the value for the initial concentration necessary to derive the volume of the compartment (Figure 5). The validity of this technique depends upon the assumption that the calculated slope of the disappearance curve of the label correctly estimates a constant removal rate of the label following completed mixing. These requirements are met by the current clinically validated BVA-100 methodology, as discussed further below.
Contemporary BVA-100 methodology
Current quantitative evaluations of total BV employ the indicator-dilution principle; however, the methodology has advanced with the use of a standardized semi-automated computer-based and clinically available technology to administer low doses (5–30 microcurie) of iodinated labelled albumin (I-131) intravenously (Volumex; Daxor Corp., New York, NY, USA). The radiolabelled albumin is injected intravenously, and from a venous catheter in the contralateral forearm 4 cc of blood samples are collected at time 0 (pre-injection of the labelled albumin) and 12, 18, 24, 30 and 36 minutes post-injection (Suppl Figure 1). The technique can be implemented at the hospital bedside or, for outpatients, in the clinical nuclear medicine laboratory and requires about an hour to complete, with a general result turnaround time of 2 hours. This technique, however, requires the placement of intravenous access to both forearms and a steady state clinical status, such that application of the technique in patients who are not haemodynamically stable or experiencing rapid volume changes would not provide reliable findings. Sequential use of the technique in less than 24–hour intervals is generally not recommended but can be done with an adequate assessment of a new baseline of radioactivity. Local nuclear medicine laboratory protocols may, however, restrict the frequency of use.
The plasma radioactivity of each sample is measured in duplicate in a semi-automated computerized counter, BVA-100® (Blood Volume Analyzer; Daxor Corp., New York, NY, USA), which was approved by the US Food and Drug Administration in 1998. PV can be measured by back extrapolation of the blood sample radioactivity to time zero (Suppl Figure 2). Total BV is quantitated using the measured PV and the patient’s peripheral venous haematocrit. Each patient’s peripheral haematocrit is normalized to a mean body haematocrit and adjusted for the patient’s haematocrit as if the PV was expanded or contracted to establish a normal total BV. RBC mass (in millilitres or litres) is calculated using mean whole-body haematocrit (mWBHct) corrected from the patient’s peripheral venous haematocrit and adjusted for trapped plasma. This allows the calculation of RBC mass: [(PV/1-mWBHct) × mWBHct = RBC mass]. The term ‘RBC mass‘ is used as a volume measure of the quantity of RBCs (mass) to distinguish it from the concentration of RBCs, such as Hb (g/dL), and, also to distinguish it from the clinical haematology term relating to the dimensional volume of RBCs.
Normal reference BV values are calculated using the per cent deviation from the normal body weight method. Values are derived using measurements from Metropolitan Life Insurance tables for age, gender, weight and height,42–44 and the normal reference volumes for the individual patient are incorporated into the computer-based algorithm. The BVA-100 methodology has been validated against the double-labelling technique of chromium–tagged RBCs and plasma albumin 1–125 (the gold standard method), with the resulting volumes being within 1%.45,46 By this technique, normal total blood volume (TBV) is defined as measured volumes within ±8% of the expected normal volume for each individual patient and RBC mass and PV as measured volumes within ±10% of referenced normal volumes. This reflects approximately 3 standard deviations from the expected normal values and assures that volumes lying beyond these deviations are not normal volumes for individual patients. Mild–to–moderate TBV expansion is defined as >+8% (>+10% for RBC mass and PV) to <+25%, and large expansion as ≥+25% of the normal volume. Volumes are reported as absolute values in millilitres or litres and as a percentage of the normal volume reported as within the normal range or a deficit (-) or as an excess (+) from the expected normal volume. By this technique, TBV quantitation has an intra-individual reproducibility of ±2.5%; it has been validated clinically and in research analyses25,26,30–34,47–50 and has been recommended for the quantitative assessment of TBV for its precision and reproducibility by the International Committee for Standardization in Hematology.45,46 When employed clinically, this methodology provides a tool to identify individual patient BV profiles and can, therefore, guide appropriate volume management strategies where surrogate measures or clinical assessments are not adequate.
Identifying blood volume profiles by quantitative volume analysis in patients with chronic heart failure: key to guiding volume management and outcomes
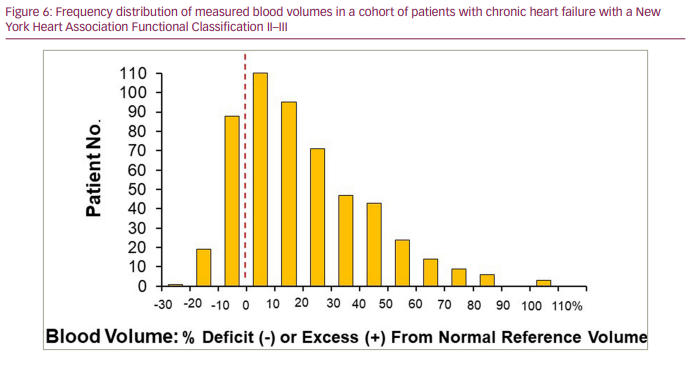
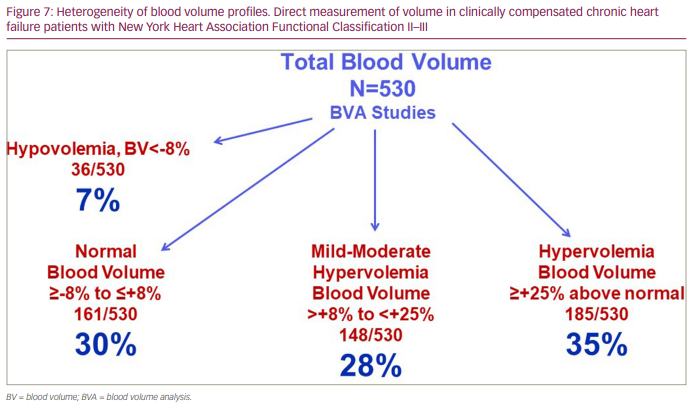
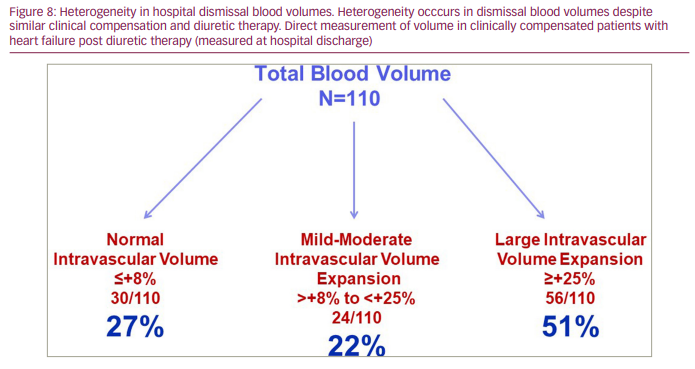
BV expansion in systolic HF is a compensatory response to the impact of reduced cardiac output and arterial underfilling; as a result, even asymptomatic patients with chronic HF can be hypervolemic, which often goes unrecognized clinically.25 As a marker of advanced HF, congestion has been linked to poor outcomes,1–4,51,52 and American College of Cardiology/American Heart Association practice guidelines recommend not discharging patients from the hospital until ‘euvolemia‘ is achieved.53 However, patients with HF, even when considered clinically euvolemic, can demonstrate marked heterogeneity in their BV profiles, and this variability in intravascular volume cannot be identified without measuring BV.34,50,54 Data from our laboratory, as shown in Figure 6 and Figure 7, demonstrate this heterogeneity reflected in 530 BV analyses in a cohort of patients with chronic HF with a New York Heart Association Functional Classification of II-III. The importance of identifying this heterogeneity also extends to patients with HF at the time of hospital discharge, despite similar clinical compensation following diuretic therapy (Figure 8).34,50 These patients experience substantial fluid loss from the interstitial compartment, as reflected by kilogram decreases in body weight. However, intravascular volumes decrease on average by only 10–12% from admission BV, and only 20% of patients demonstrate significant volume changes from admission BV profiles.34 These findings support the complex volume-related pathophysiology of HF and what we still need to learn regarding fluid volume homeostasis and regulation in the spectrum of patients with HF.
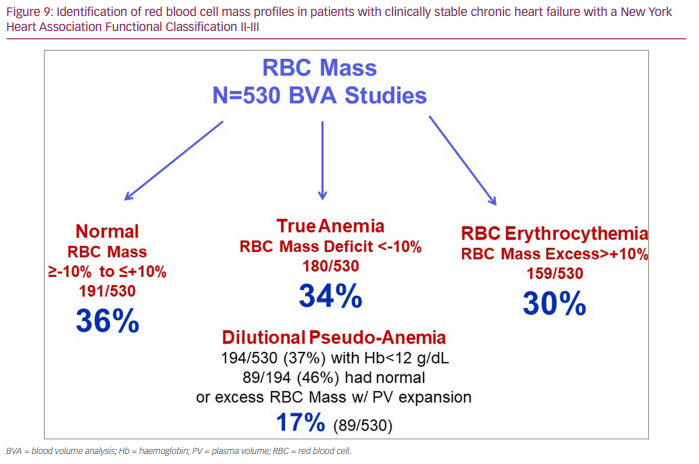
Another factor not commonly considered in the volume assessments of patients with HF is the contribution of RBCs (the mass, not the concentration, of RBCs) to intravascular volume. The impact of RBC mass often goes underrecognized or is without immediate volume-related clinical relevance. RBC mass profiles are also heterogeneous in patients with chronic HF (Table 2); therefore, distinguishing true anaemia (a deficit in RBC mass), normal RBC mass and RBC polycythaemia (an excess in RBC mass) in relation to intravascular volume status and clinical outcomes can provide important insights into the management of HF.32,50,55 Current methodology permits the identification and quantitative assessment of these different RBC mass phenotypes. Figure 9 demonstrates the heterogeneity found in the 530 BV analyses as described above.
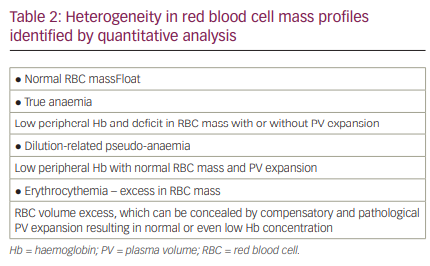
While a common metric to assess anaemia, peripheral venous Hb concentration can be misleading as an index for true RBC mass and, therefore, overall intravascular volume.31,32,47 A low venous Hb concentration may reflect true anaemia with RBC mass deficit; however, it may also reflect a dilution-related ‘pseudo-anaemia‘, where RBC mass is normal but where pathological PV expansion has developed, resulting in a dilution of Hb concentration and a misinterpretation of anaemia. Therefore, the interpretation of intravascular volume status needs to factor in RBC mass and PV phenotypes. This would permit better identification of patients with HF who would respond optimally to interventions such as RBC transfusion or iron replacement therapies. Importantly, it would allow the identification of individuals who have a normal RBC mass without iron deficiency despite the measurement of a low peripheral venous Hb concentration, thus avoiding inappropriate treatment. Moreover, the ability to identify the different RBC mass phenotypes in patients with chronic HF and the heterogeneity of these profiles is associated with significant differences in clinical outcomes.32,50 Therefore, knowing RBC mass phenotypes can be highly relevant when considering an approach to volume management and a contribution to risk stratification.
Importantly, the finding that RBC polycythaemia (RBC mass excess with compensatory PV expansion) is a significant contributor to intravascular volume expansion in patients with chronic HF is common,32,47,55 and multivariate analyses showed it to be an independent predictor of better, not worse, outcomes relative to a normal RBC mass.32,50 In contrast, true anaemia, which is also common in patients with chronic HF, is an independent predictor in relation to normal RBC mass of increased risk of HF-related mortality and re-hospitalization. Dilutional pseudo-anaemia, which cannot be identified by Hb concentration alone, is also present in a substantial number of HF patients (5–10%) and potentially carries a different impact on clinical outcomes. The importance of distinguishing dilutional pseudo-anaemia from true anaemia, along with the presence or absence of an iron deficiency, can significantly impact the approach to patient management and help guide the most appropriate therapies.
What does this mean clinically?
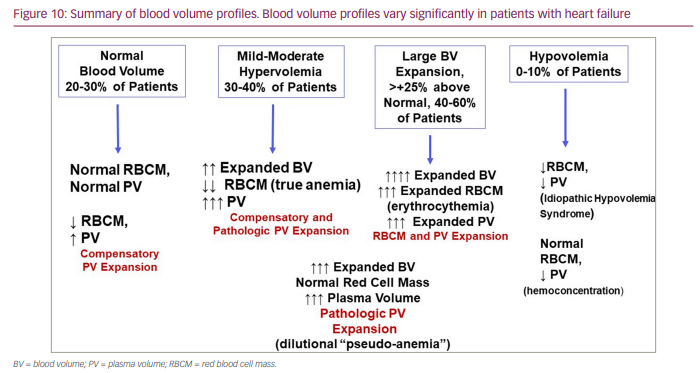
The ability to quantitate BV and identify differences in BV profiles (to include RBC mass phenotypes) among patients with HF, which are summarized in Figure 10, using available methodologies provides a useful tool for diagnosing volume overload in HF, guides the selection of the most appropriate approaches to diuretic therapy (i.e. when to administer more or less diuretic therapy or when to discontinue it), and stratifies risk in the spectrum of patients with chronic HF. Currently, patients with HF considered to be volume overloaded clinically have been commonly treated very similarly, with a focus on diuresis intervention. This may not always be optimal, given the heterogeneity in volume profiles identified in these patients and that some patients are even intravascularly volume contracted despite clinical findings suggesting volume overload, such as the presence of lower extremity oedema. In such patients, administering a too aggressive diuresis treatment could be detrimental. Therefore, BV must be measured to understand the heterogeneity and clinical significance of BV profiles; this is where evolving quantitative technologies can make a difference in the assessment and management of patients with HF. Randomized clinical trial data assessing the standard of care versus volume-guided management are needed to determine whether volume can be adequately manipulated as needed to a predetermined optimal volume and if that managed volume is associated with better outcomes of lower HF-related mortality and hospitalizations. Limited studies are available; however, they support better clinical outcomes with the use of volume-guided management.56–58 While randomized controlled studies will add rigour to any recommended use of BV analysis to improve patient outcomes, it is also important to recognize the value of identifying intravascular volume profiles (to include distinguishing differing RBC profiles) for more individualized patient care strategies.
Conclusions
Given the substantial HF epidemic worldwide and the high frequency of HF-related hospitalizations and re-hospitalizations currently being faced by the clinical community, it is imperative that every tool be made available to help diagnose and optimize patient care. HF-related hospitalizations are commonly the result of volume excess or volume redistribution issues that result in clinical decompensation. Therefore, being able to assess volume status accurately is a key element in effective patient management strategies. As discussed in this review, which focused on BVA-100 methodology, the clinically available tools for quantitating intravascular volume and identifying different BV profiles and phenotypes, and their clinical implications, are central to effectively managing and, potentially, impacting the outcomes in patients with HF.
Identifying an optimal BV and how to effectively manage patients with HF to maintain that optimal volume state remains a fundamental issue concerning volume management. Historical and contemporary data would suggest that optimal volume is likely to be a compensatory expansion in intravascular volume and not a ‘normal‘ volume. This may require reconsideration of what ‘euvolemia‘ means and its implications for clinical outcomes and clinical trials. Whether this, in turn, would impact re-hospitalization rates and long-term mortality requires more study. The clinical availability of the current BVA-100 technology provides the opportunity to quantify total BV with its components, which can progress our understanding of the pathophysiology of volume homeostasis in HF and the ability to guide more individualized volume management strategies to help improve day-to-day quality of life for our patients.