touchCARDIO touchCARDIO
COVID-19, Devices
Read Time: 2 mins

96/Impact of COVID-19 on ventricular tachycardia and atrial tachycardia events in patients with transvenous devices

Copy Link
Published Online: Sep 27th 2010 Heart International. 2020;14(1):16–9 DOI: https://doi.org/10.17925/HI.2020.14.1.16
Authors: C Monkhouse (Presenting Author) - Barts Heart Centre, London; A Chow - Barts Heart Centre, London; R Hunter - Barts Heart Centre, London; P Lambiase - Barts Heart Centre, London; M Earley - Barts Heart Centre, London; RJ Schilling - Barts Heart Centre, London; N Srinivasan - Barts Heart Centre, London
Quick Links:
Article
Article Information
Article:

Background: Covid-19 is an infectious disease caused by severe acute respiratory syndrome coronavirus 2 (SARS-CoV-2). It has resulted in a significant number of increased hospitalizations and excess deaths worldwide. Though reports regarding myocardial injury/inflammation relating to Covid-19 are known, little is known about larger scale effects of the virus on cardiac arrhythmias. Additionally, it is known that autonomics play a large role in the incidence of cardiac arrhythmias, and the temporal relationship of the national lockdown on cardiac arrhythmias has not well characterized. We aimed to assess the temporal trends of cardiac arrhythmias seen in the Barts device clinic and compare it to the previous year. Hypothesizing that there had been a decrease in the burden of Ventricular Tachycardia (VT).

Methods: We exported all arrhythmia events that have been transmitted to the Latitude remote monitoring platform (Boston Scientific) retrospectively between January 2020 to May 2020 and January 2019 to May 2019. We will compare trends against the previous year to exclude any seasonal variation.

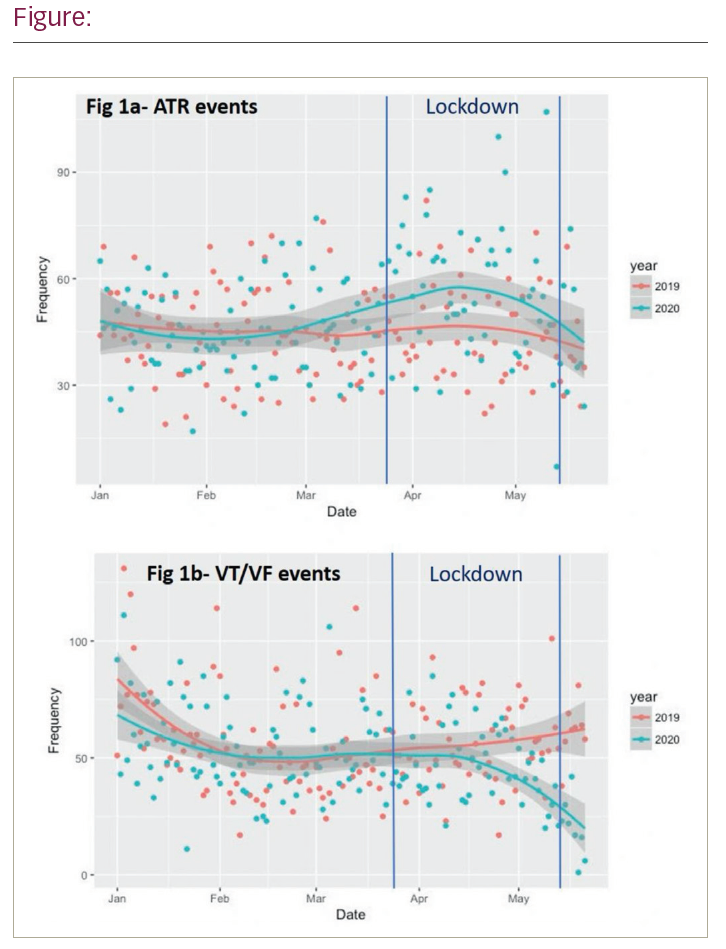
Results: From the cohort of 2,110 patients on latitude remote monitoring, this produced 28,005 arrhythmia episodes in the study period. From January to 21 May 2019 there were 7,940 Ventricular events (Mean 56/day; SD ± 20) vs 7,017 events (Mean 49/day; SD ± 19) in the same time period in 2020. Figure 1A shows a lowess regression curve of ventricular events in 2019 vs 2020 with confidence intervals. It can be seen that events are largely similar until after lockdown when there are fewer ventricular events, Annova with Turkey post hoc correction (p=0.01, mean difference 19 events per day). From January to 21 May 2019 there were 6,380 atrial events (Mean 45/day; SD ± 13) compared with 6,690 events during the same time period in 2020 (Mean 49/day; SD ± 16). Figure 1B shows a lowess regression curve of atrial events in 2019 vs 2020 with confidence intervals. It can be seen that events are largely similar until lockdown there is an increase on atrial events, Anova with Tukey post hoc correction (p=0.02, mean difference 12 events per day).

Conclusion: These data suggest that ventricular events were largely similar pre-lockdown but decreased during the lockdown, while atrial events increased during the period of the lockdown before normalizing. This suggests that autonomic and psychological impacts of lockdown had an important effect on the frequency of atrial and ventricular events that presented to our joint VT clinic, and underlines the important role of the autonomic nervous system in arrhythmia.


Further Resources

Share this Article
Related Content In Devices
  • Copied to clipboard!
    accredited arrow-down-editablearrow-downarrow_leftarrow-right-bluearrow-right-dark-bluearrow-right-greenarrow-right-greyarrow-right-orangearrow-right-whitearrow-right-bluearrow-up-orangeavatarcalendarchevron-down consultant-pathologist-nurseconsultant-pathologistcrosscrossdownloademailexclaimationfeedbackfiltergraph-arrowinterviewslinkmdt_iconmenumore_dots nurse-consultantpadlock patient-advocate-pathologistpatient-consultantpatientperson pharmacist-nurseplay_buttonplay-colour-tmcplay-colourAsset 1podcastprinter scenerysearch share single-doctor social_facebooksocial_googleplussocial_instagramsocial_linkedin_altsocial_linkedin_altsocial_pinterestlogo-twitter-glyph-32social_youtubeshape-star (1)tick-bluetick-orangetick-red tick-whiteticktimetranscriptup-arrowwebinar Sponsored Department Location NEW TMM Corporate Services Icons-07NEW TMM Corporate Services Icons-08NEW TMM Corporate Services Icons-09NEW TMM Corporate Services Icons-10NEW TMM Corporate Services Icons-11NEW TMM Corporate Services Icons-12Salary £ TMM-Corp-Site-Icons-01TMM-Corp-Site-Icons-02TMM-Corp-Site-Icons-03TMM-Corp-Site-Icons-04TMM-Corp-Site-Icons-05TMM-Corp-Site-Icons-06TMM-Corp-Site-Icons-07TMM-Corp-Site-Icons-08TMM-Corp-Site-Icons-09TMM-Corp-Site-Icons-10TMM-Corp-Site-Icons-11TMM-Corp-Site-Icons-12TMM-Corp-Site-Icons-13TMM-Corp-Site-Icons-14TMM-Corp-Site-Icons-15TMM-Corp-Site-Icons-16TMM-Corp-Site-Icons-17TMM-Corp-Site-Icons-18TMM-Corp-Site-Icons-19TMM-Corp-Site-Icons-20TMM-Corp-Site-Icons-21TMM-Corp-Site-Icons-22TMM-Corp-Site-Icons-23TMM-Corp-Site-Icons-24TMM-Corp-Site-Icons-25TMM-Corp-Site-Icons-26TMM-Corp-Site-Icons-27TMM-Corp-Site-Icons-28TMM-Corp-Site-Icons-29TMM-Corp-Site-Icons-30TMM-Corp-Site-Icons-31TMM-Corp-Site-Icons-32TMM-Corp-Site-Icons-33TMM-Corp-Site-Icons-34TMM-Corp-Site-Icons-35TMM-Corp-Site-Icons-36TMM-Corp-Site-Icons-37TMM-Corp-Site-Icons-38TMM-Corp-Site-Icons-39TMM-Corp-Site-Icons-40TMM-Corp-Site-Icons-41TMM-Corp-Site-Icons-42TMM-Corp-Site-Icons-43TMM-Corp-Site-Icons-44TMM-Corp-Site-Icons-45TMM-Corp-Site-Icons-46TMM-Corp-Site-Icons-47TMM-Corp-Site-Icons-48TMM-Corp-Site-Icons-49TMM-Corp-Site-Icons-50TMM-Corp-Site-Icons-51TMM-Corp-Site-Icons-52TMM-Corp-Site-Icons-53TMM-Corp-Site-Icons-54TMM-Corp-Site-Icons-55TMM-Corp-Site-Icons-56TMM-Corp-Site-Icons-57TMM-Corp-Site-Icons-58TMM-Corp-Site-Icons-59TMM-Corp-Site-Icons-60TMM-Corp-Site-Icons-61TMM-Corp-Site-Icons-62TMM-Corp-Site-Icons-63TMM-Corp-Site-Icons-64TMM-Corp-Site-Icons-65TMM-Corp-Site-Icons-66TMM-Corp-Site-Icons-67TMM-Corp-Site-Icons-68TMM-Corp-Site-Icons-69TMM-Corp-Site-Icons-70TMM-Corp-Site-Icons-71TMM-Corp-Site-Icons-72