Cardiovascular disease (CVD) continues to be the leading cause of death on a global scale. Nearly 18 million people died from CVD in 2019, accounting for about one-third of all deaths globally.1 The primary cause of CVD-related death and morbidity is ischaemic heart disease (IHD). Since 1990, the total number of disability adjusted life years (DALYs) attributable to IHD has progressively increased, reaching 182 million DALYs and about 9.14 million fatalities in 2019.1 As the incidence and prevalence of IHD continue to rise, there is a pressing need for reliable diagnostic techniques that can precisely detect atherosclerotic coronary artery disease (CAD) and guide in delivering effective therapies to revert these trends.
In clinical practice, a variety of methods are used to assess for CAD and to predict the risk of cardiovascular death. The coronary artery calcium (CAC) score, which is measured using a simple non-contrast computed tomography (CT), is one of several diagnostic tools used to evaluate CAD. CAC is a powerful predictor of future cardiovascular events and is a well-established marker of subclinical atherosclerosis.2–4 CAC testing is also widely available, extensively studied and economically sustainable for assessing CAD. Additionally, current American College of Cardiology (ACC) and the American Heart Association (AHA) guidelines, as well as European guidelines, advocate for the use of CAC to guide atherosclerotic cardiovascular disease (ASCVD) risk discussion between clinician and patient for intermediate-risk adults (≥7.5–20%, 10-year ASCVD risk) when traditional risk factor-based preventive interventions remain uncertain.5,6
Despite CAC being an established marker of atherosclerosis and an excellent prognostication tool, the current trend is moving towards measurement of quantitative plaque volumes utilizing coronary computed tomography angiography (CCTA). CCTA enables quantitative plaque analysis and can identify distinct plaque phenotypes and their relative plaque burden, which may provide additional prognostic value. Recent data from the COronary CT Angiography EvaluatioN For Clinical Outcomes: An InteRnational Multicenter (CONFIRM) registry suggests that global plaque burden is prognostically relevant for adverse cardiac events.7 Additionally, data from the Progression of AtheRosclerotic PlAque DetermIned by Computed TomoGraphic Angiography IMaging (PARADIGM) registry demonstrated that high calcified plaque volume (CPV) is associated with an increased risk of major adverse cardiovascular events.8
To date, the relationship between CAC score and CPV is not well understood and at times these two entities are mistaken as similar measures. However, they both are significantly different measures and are not the same. Based on these premises, in this study, we sought to evaluate the relationship between CAC and CPV and their ability to predict obstructive CAD. Additionally, we evaluated the correlation between total plaque volume (TPV) and CAC and the predictive ability of TPV in detecting obstructive CAD. The primary purpose of this study is to evaluate the relationship between CAC and CPV, CAC and TPV, and to explore the diagnostic performance of CAC, CPV and TPV in detecting obstructive CAD.
Methods
Study population and design
The aim of this study is to provide a cross-sectional examination of relationship between CAC and CPV, and CAC and TPV, and their predictive ability in detecting obstructive CAD. Data was obtained from CT EvaLuation by Artificial Intelligence For Atherosclerosis Stenosis and Vascular Morphology (CLARIFY) study. We performed a subgroup analysis in 147 subjects of the total 232 participants in CLARIFY study. Patients were selected from high volume cardiac CT centers where they underwent CCTA for the evaluation of acute and stable chest pain.9 We included all examinations where CCTA and CAC was performed as part of chest pain evaluation. Only 147 subjects out of 232 participants had coronary calcium scans. We excluded examinations with stents, bypass grafts, poor contrast enhancement and significant artifacts. This is a retrospective study, data was obtained from electronic medical records. The study was determined to be exempt from ethical approval by the institutional review board.
Cardiac computed tomography acquisition protocol
All CT scans were performed using either a 64-multidetector CT (MDCT) General Electric VCT (GE Healthcare, Milwaukee, WI, USA) or 128-dual source CT (DSCT) Siemens FLASH (Siemens Healthcare, Erlangen, Germany). All the participants included in this subanalysis underwent both CCTA and CAC scans. Acquisition techniques included both prospective and retrospective gating, depending on the institutional protocols. Iterative reconstruction was used on the DSCT scanners but not on the General Electric VCT scanners. Examinations were reconstructed at 5–10% increments. Patients were given beta blockers, nitroglycerin and iodinated contrast in accordance with institutional and Society of Cardiovascular Computed Tomography (SCCT) protocols for CCTA examinations.10 Before CCTA, a non-enhanced electocardiogram (ECG)-gated coronary calcium scan was performed for all subjects.
Coronary plaque assessment and quantification
Automated quantitative plaque analysis software was utilized to obtain quantitative plaque measurements. CCTA studies were uploaded to and analyzed by Cleerly LABS (Cleerly Health, Inc, Denver, CO, USA), software approved for use by the US Food and Drug Administration (FDA).11 This study was an investigator-initiated study and Cleerly Health had no role in the study design or performance. Cleerly Health performed artificial intelligence (AI)-aided CCTA analyses for the study in a blinded manner and provided statistical services as determined and requested by the study investigators. This is an AI-aided approach that performs automated analysis of CCTA using a series of validated convolutional neural network models for plaque characterization and quantification (Figure 1).
Figure 1: Quantitative plaque analysis from coronary computed tomography angiography utilizing specialized software
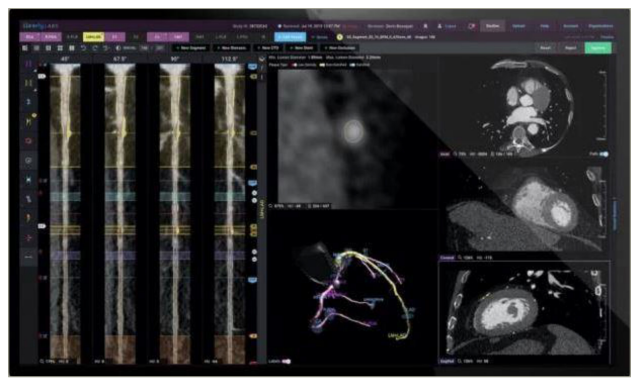
This AI-assisted approach utilizes two deep convolutional neural networks to generate a centreline throughout the vessel’s length and then contour the lumen and outer vessel wall. If many phases/series of the CCTA examination were present, this technique was used to enable phase-specific evaluation at the coronary segment vessel. The programme analyzed all series and chose the best two for additional analysis, which included vessel and lumen segmentation, plaque quantification and stenosis quantification. After coronary artery segmentation, an automated labelling procedure was used to identify arteries according to their location and the proximal, mid and distal segments within a single vessel. Additionally, the AI enabled the definition of coronary artery lesions (i.e., those areas where plaque was present). The severity of percent diameter stenosis was automatically determined using a normal proximal reference vessel cross-sectional slide, the start and end of the lesion, and the cross-sectional slice, demonstrating the greatest absolute narrowing. The software identified the beginning and end of lesions and dropped stenosis indicators in the location with the most stenosis. Plaque was assessed similarly within coronary artery lesions and further classified as low-attenuation non-calcified plaque, non-calcified plaque and calcified plaque based on Hounsfield unit (HU) densities of less than 30, -189 to 350, and >350 respectively.9 TPV was the sum of all types of non-calcified plaque and calcified plaque.
The AI model was based on a territory-based analysis of the left main (LM) artery; left anterior descending (LAD) artery, including diagonals and ramus intermedius; left circumflex (LCx) artery, including obtuse marginals, left posterior descending and posterolateral branches; and right coronary artery (RCA), including right posterolateral and posterior descending branches. Vessel length, vessel volume, lumen volume, total plaque volume, calcified plaque volume, non-calcified plaque volume, low density non-calcified plaque volume and maximum diameter and area stenosis was measured for each territory. Obstructive CAD was defined as moderate for >50% stenosis and as severe for >70% stenosis. After the AI algorithm had completed all operations, as required by the FDA, a quality control cardiac CT qualified technician reviewed and adjusted the results of the AI analysis for all subjects. Visual evaluation of the lumen and vessel borders was performed on straightened multiplanar reformat images of all vessels 1.5 mm and bigger, as well as on each cross-section of each of these vessels in contiguous 0.25 mm increments.9
Coronary artery calcium scoring
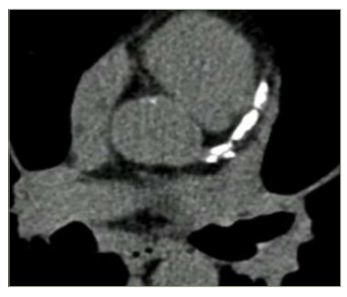
All the scans were ECG-gated chest CT scans. Cardiac ECG gating lowers measurement errors by timing the acquisition of images for each level of the scan to a certain phase of the heart cycle. The threshold for a calcified lesion was set at a CT density of ≥130 HU, and the CAC was calculated using the Agatston method. This method used the weighted sum of lesions that had a density of ≥130 HU and multiplied the area of calcium with the relevant factor of maximum plaque attenuation: 130–199 HU multiplied by factor 1; 200–299 HU multiplied by 2; 300–399 HU by factor 3; and ≥400 HU by factor 4. This process of calculating CAC score is different from obtaining CPV on CCTA scans. Previous studies have described the Agatston process and the protocol used in detail.12 Per-vessel territory calcium score and total calcium score was recorded (Figure 2).
Figure 2: Coronary artery calcium from non-contrast computed tomography scan
Statistical analysis
Analyses of the subjects baseline characteristics, including demographic variables, CAD risk factors, CAC score and CPVs, were performed. Continuous variables are presented as mean ± standard deviation (SD) unless otherwise noted for non-parametric variables. Categorical variables are reported as frequencies with percentages. The Spearman correlation coefficient was used to evaluate correlation between CAC and CPV, and CAC and TPV. Diagnostic performance of each measure in detecting >50% and >70% stenosis was evaluated using receiver operating curve (ROC) analysis per vessel and per patient. A CAC score of 100 and plaque volume of 25 mm3 (for both CPV and TPV) were the binary optimal cutoff points determined by sensitivity and specificity analysis for >50% and >70% stenosis that was used to perform the ROC analysis. Diagnostic performance was assessed through sensitivity, specificity, positive predictive value and negative predictive value.
Results
The study population consisted of N=147 subjects, the mean age (SD) was 58.7 (11.4) years, 55.8% were male and 50% were African American. The study participants reported comorbidities including diabetes (61%), dyslipidaemia (31%), hypertension (29%); 37% of participants were current smokers. Demographic data is reported in Table 1.
Table 1: Demographics
|
Variable |
Result |
|
Mean age in years (SD) |
58.7 ± 11.4 |
|
Sex, % (n) |
|
|
Female |
44.2% (65) |
|
Male |
55.8% (82) |
|
Race, % (n) |
|
|
Caucasian |
30% (44) |
|
African/African American |
50% (74) |
|
East Asian |
3% (3) |
|
South Asian |
1% (1) |
|
Middle Eastern |
1% (1) |
|
Other or mixed |
6% (9) |
|
Unknown |
10% (15) |
|
Comorbidities |
|
|
Hypertension |
29% (44) |
|
Diabetes |
61% (89) |
|
Dyslipidemia |
31% (45) |
|
Smoking status, % (n) |
|
|
Never |
41% (60) |
|
Current |
37% (54) |
|
Past |
22% (33) |
|
Family history of early CAD, % (n) |
36% (52) |
Data available for N=147.
CAD = coronary artery disease;SD = standard deviation.
Coronary artery calcium and calcified plaque volume
There is a strong correlation between CAC and CPV (r=0.76, p<0.001) in per-patient analysis. ROC analysis was performed utilizing the optimal binary threshold of 100 for CAC and 25 mm3 for CPV in this cohort. In per-patient analysis, area under the curve (AUC) for CAC was 0.86 and for CPV was 0.81 for detecting >50% obstructive CAD. The AUC was 0.83 for both CAC and CPV for detecting >70% obstructive CAD. The sensitivity of CPV was 77%, which was higher than the sensitivity of CAC (68%) in detecting >50% stenosis. Similarly, for detecting >70% stenosis, CPV had higher sensitivity of 88% compared with 63% for CAC. The negative predictive value of CAC and CPV was comparable (Table 2).
Table 2: Summary of diagnostic performance per patient
|
Predictor |
Reference standard |
AUC |
Binary Threshold
|
Sensitivity |
Specificity |
PPV |
NPV |
|
Total plaque volume |
>50% stenosis |
0.8934 |
25 mm3
|
100.0% |
29.5% |
20.4% |
100.0% |
|
Calcified plaque volume |
>50% stenosis |
0.8107 |
25 mm3
|
77.3% |
59.8% |
25.8% |
93.6% |
|
CAC |
>50% stenosis |
0.8579 |
100 |
68.2% |
83.6% |
42.9% |
93.6% |
|
Total plaque volume |
>70% stenosis |
0.8699 |
25 mm3
|
100.0% |
26.5% |
7.4% |
100.0% |
|
Calcified plaque volume |
>70% stenosis |
0.8309 |
25 mm3
|
87.5% |
56.6% |
10.6% |
98.7% |
|
CAC |
>70% stenosis |
0.8336 |
100 |
62.5% |
77.9% |
14.3% |
97.3% |
*The diagnostic performance of total plaque volume, calcified plaque volume and CAC was calculated using binary threshold for quantitative plaque and CAC for detecting >50% stenosis and >70% stenosis on per patient basis
AUC = area under the curve;CAC = coronary artery calcium;NPV = negative predictive value;PPV = positive predictive value.
Similar results were noted in the per-vessel analysis. There is good correlation between CAC and CPV (r=0.73, p<0.001). For >50% stenosis, the AUC was 0.85 and 0.87 for CAC and CPV, respectively; for >70% stenosis, the AUC was 0.77 and 0.81 for CAC and CPV, respectively. The sensitivity of CPV was higher compared with CAC in detecting both >50% and >70% stenosis, but with lower specificity of CPV. The negative predictive value was similar for CAC and CPV (Table 3).
Table 3: Summary of diagnostic performance per vessel
|
Predictor |
Reference standard |
AUC |
Binary threshold |
Sensitivity |
Specificity |
PPV |
NPV |
|
Total plaque volume |
>50% stenosis |
0.9321 |
25 mm3 |
97.0% |
71.0% |
17.0% |
99.7% |
|
Calcified plaque volume |
>50% stenosis |
0.8657 |
25 mm3 |
66.0% |
90% |
29.0% |
98.0% |
|
CAC |
>50% stenosis |
0.8456 |
100 |
50.0% |
94.0% |
35.0% |
97.0% |
|
Total plaque volume |
>70% stenosis |
0.9116 |
25 mm3 |
91.0% |
68.0% |
5.0% |
99.7% |
|
Calcified plaque volume |
>70% stenosis |
0.8098 |
25 mm3 |
64.0% |
88.0% |
10.0% |
99.0% |
|
CAC |
>70% stenosis |
0.7723 |
100 |
45.0% |
93.0% |
11.0% |
99.0% |
*The diagnostic performance of total plaque volume, calcified plaque volume and CAC was calculated using binary thresholds for quantitative plaque and CAC for detecting >50% stenosis and > 70% stenosis on per vessel basis.
AUC = area under the curve;CAC = coronary artery calcium;NPV = negative predictive value;PPV = positive predictive value.
Coronary artery calcium and total plaque volume
Additionally, we evaluated the relation between CAC and TPV. In per-patient analysis, there was good correlation between CAC and TPV (r=0.72, p<0.001). AUC for CAC was 0.86, and for TPV was 0.89 for >50% stenosis. For >70% stenosis, AUC was 0.83 and 0.87 for CAC and TPV, respectively. The sensitivity of TPV was 100% in detecting >50% or >70% stenosis compared with CAC, which was 68% and 63% for >50% and >70% stenosis, respectively. TPV had a high negative predictive value of 100% compared with CAC (Table 2).
In per-vessel analysis, there was moderate correlation between CAC and CPV (r=0.67, p<0.001). The AUC was 0.85 and 0.93 for CAC and TPV, respectively, for >50% stenosis. For >70% stenosis, AUC was 0.77 and 0.91 for CAC and TPV, respectively. The sensitivity of TPV was higher compared with CAC in detecting both >50% and >70% stenosis. The negative predictive of TPV was marginally higher compared with CAC for >50% stenosis (Table 3, Figure 3, Figure 4).
Figure 3: Receiver operating characteristic curves
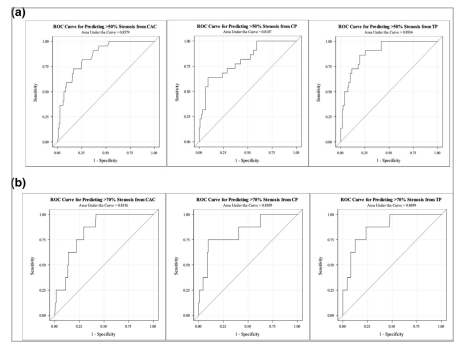
ROC for predicting >50% (a) and >70% (b) stenosis from CAC, CPV and TPV in per-patient analysis.
CAC = coronary artery calcium; CPV = calcified plaque volume; ROC = receiver operating characteristic; TPV = total plaque volume.
Figure 4: Receiver operating characteristic curves
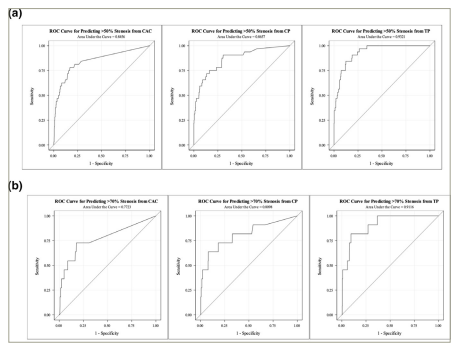
A: ROC for predicting >50% stenosis for CAC, CPV and TPV in per-vessel analysis. B: ROC for predicting >70% stenosis from CAC, CPV and TPV in per-vessel analysis.
CAC = coronary artery calcium; CPV = calcified plaque volume; ROC = receiver operating curve; TPV = total plaque volume.
Discussion
This study demonstrated that CAC and CPV are strongly correlated, and that CPV is more sensitive than CAC score in predicting the severity of obstructive CAD. The negative predictive value of both measures is comparable. Additionally, CAC is moderately correlated with TPV, and TPV has the highest sensitivity and negative predictive value for predicting obstructive CAD. These findings highlight the relationship between CAC score, CPV and TPV measured via CCTA, and their predictive ability in evaluating CAD.
The CAC score is a well-established marker and an excellent predictor of cardiovascular mortality.4,13 Additionally, the integration of CAC in addition to traditional coronary heart disease risk factors improved risk prediction and can be used to meaningfully stratify patients into risk groups.3,14–17 Prognostic significance of CAC is supported by substantial evidence from large registries, whereas the evidence for CPV is limited. In a recent analysis from the PARADIGM registry, the prognostic value of CPV was demonstrated; high CPV on CCTA was associated with incident major adverse cardiac events.8
When comparing CAC score with CPV, it is essential to keep in mind that these two entities are entirely distinct and that their respective measurement techniques are unique. There are different methods of obtaining CAC score, mainly Agatston method, calcium volume score and calcium mass score. The Agatston method was the most widely employed approach in published research and is consequently the preferred method in current clinical practice. The Agatston method uses the weighted sum of calcium lesions with a density >130 HU and multiplies the area of calcium by a density factor related to the lesion as follows: 130–199 HU, factor 1; 200–299 HU, factor 2; 300–399 HU, factor 3; and ≥400 HU factor 4.12 CCTA measures the CPV, which is the total volume of calcium in the atherosclerotic plaque. Plaque composition is assessed using quantitative plaque analysis tools employing a predefined HU threshold; a HU of ≥350 HU is classified as calcified plaque volume, which is different from Agatston calcium score.18
It is well recognized that the CAC score is a sensitive measure of atherosclerosis with low specificity.19,20 Interestingly, in this investigation it was discovered that CAC score is less sensitive but had higher specificity when compared with CPV in detecting obstructive (>50% or >70% stenosis) CAD. A plausible explanation for low sensitivity of CAC compared with CPV is likely due to higher cutoff point of 100 for CAC. Lower CAC threshold may have improved the sensitivity of calcium score in predicting obstructive CAD. Furthermore, it has been widely known that plaques that seem purely calcified by CCTA may in fact contain modest quantities of non-calcified components, which may have accounted for the increased sensitivity of CPV. However, it is essential to note that the negative predictive values of CAC and CPV are nearly identical when analysed using per-patient and per-vessel analysis. Importantly, CAC has a greater specificity than CPV, indicating fewer false positive results in this study.
In this study we also evaluated the relationship between CAC and TPV. There was a strong correlation observed between CAC and TPV. TPV is highly sensitive in detecting obstructive CAD and has highest negative predictive value. This finding is expected as total plaque includes both calcified plaque and non-calcified plaque burden. It is well known that total plaque burden is a better predictor of outcomes. In the CONFIRM study, the extent of atherosclerosis was found to have more predictive significance than risk factors alone in non-obstructive CAD.21 Furthermore, prior studies have demonstrated that plaque burden found on CCTA is associated with stenosis severity, extent of ischaemia and improved prediction of mortality.22–25 CCTA provides information on the degree of stenosis, high-risk plaque features and a plethora of other imaging determinants of adverse cardiovascular events, all of which are useful for prognosis. Therefore, additional information obtained from CCTA beyond CPV and total plaque volume will undoubtedly provide additive value for risk prediction.
To date, the relationship between CAC and quantitative plaque volumes obtained from CCTA and their prognostic value has been inadequately described. As previously discussed, CAC score and CPV obtained by cardiac CT are two different measures with difference measurement techniques; however, they have a comparable negative predictive value. This study elucidates the difference between CAC and CPV and helps to understand their prognostic value. TPV has additional value over CAC as it incorporates the non-calcified plaque burden. CAC and CCTA both have independent value in the evaluation of CAD. It is crucial to appropriately risk stratify patients and assess pretest probability before deciding the right modality of imaging. Our healthcare system already invests heavily on testing but still performs poorly in terms of healthcare cost and life expectancy compared to other developed countries at global level.26 It is crucial to utilize the least expensive and safest tests that can provide the maximum information that is relevant to the question asked. Keeping these factors in mind, it is hard to justify CCTA testing in all patients, especially in patients with low-risk asymptomatic or non-cardiac chest pain. The CAC score, which has excellent correlation with CPV and TPV, will serve as the initial modality of imaging to appropriately risk stratify patients, followed by CCTA if needed.
Current data suggest that the evidence for using CAC score for risk assessment in asymptomatic and low risk individuals is robust.27–30 It is also a well-established marker to guide statin and aspirin therapy as primary prevention in patients with uncertain risk classification based on traditional risk scores.31,32 In patients with symptoms, CCTA will offer additional value in evaluating for obstructive disease and may also identify haemodynamically significant stenotic lesions that may need intervention or detect non-obstructive CAD, which will allow for further risk stratification. The potential of using a strategy to screen all patients with CCTA for subclinical atherosclerosis in the general population to improve risk classification or add prognostic value in addition to calcium score is currently unknown. In the future, in subpopulations, CCTA may play a role in risk stratifying individual patients based on the degree of stenosis, plaque morphology, high-risk plaque features and total plaque burden.33,34 Furthermore, it may also play a role in tracking plaque burden and composition, and in evaluating the response to medical therapies, which is a task CAC scanning alone is unable to perform.
This study is not without limitations. It is a cross-sectional study with a small sample size and subjects are not stratified based on symptoms of chest pain. A CAC score threshold of 100 was utilized, and CAC scores closer to zero have better predictive value of ruling out obstructive CAD. This may have affected the sensitivity of CAC score in this study in predicting obstructive CAD. Additionally, obstructive CAD was classified based on CCTA findings instead of gold-standard quantitative coronary angiography. It is known that with increasing levels of CAC, the diagnostic specificity of CCTA is reduced. The main strength of this study is the direct comparison of CAC and CPV in predicting obstructive CAD and their prognostic value, which has not been described well in the literature. This study also demonstrates how CAC and CPV differ in their measurement techniques and how their prognostic value are essentially not the same.
Conclusion
CPV and TPV are more sensitive in predicting the severity of obstructive CAD compared with the CAC score. However, the negative predictive value of CAC is comparable to CPV, but is lower than TPV. CAC score can serve as the initial screening modality of imaging to appropriately risk stratify patients that may benefit from CCTA if needed. Additionally, this study elucidates the relationship between CAC and quantitative plaque types, emphasizing the similarities and differences when assessing for obstructive CAD. It also highlights the judicious use of testing modalities to risk stratify patients and achieve the greatest benefit from the least expensive and safest test possible.